New-home prices in Metro Vancouver down 2.5% in a year as Kelowna and Victoria hit lowest since 2021

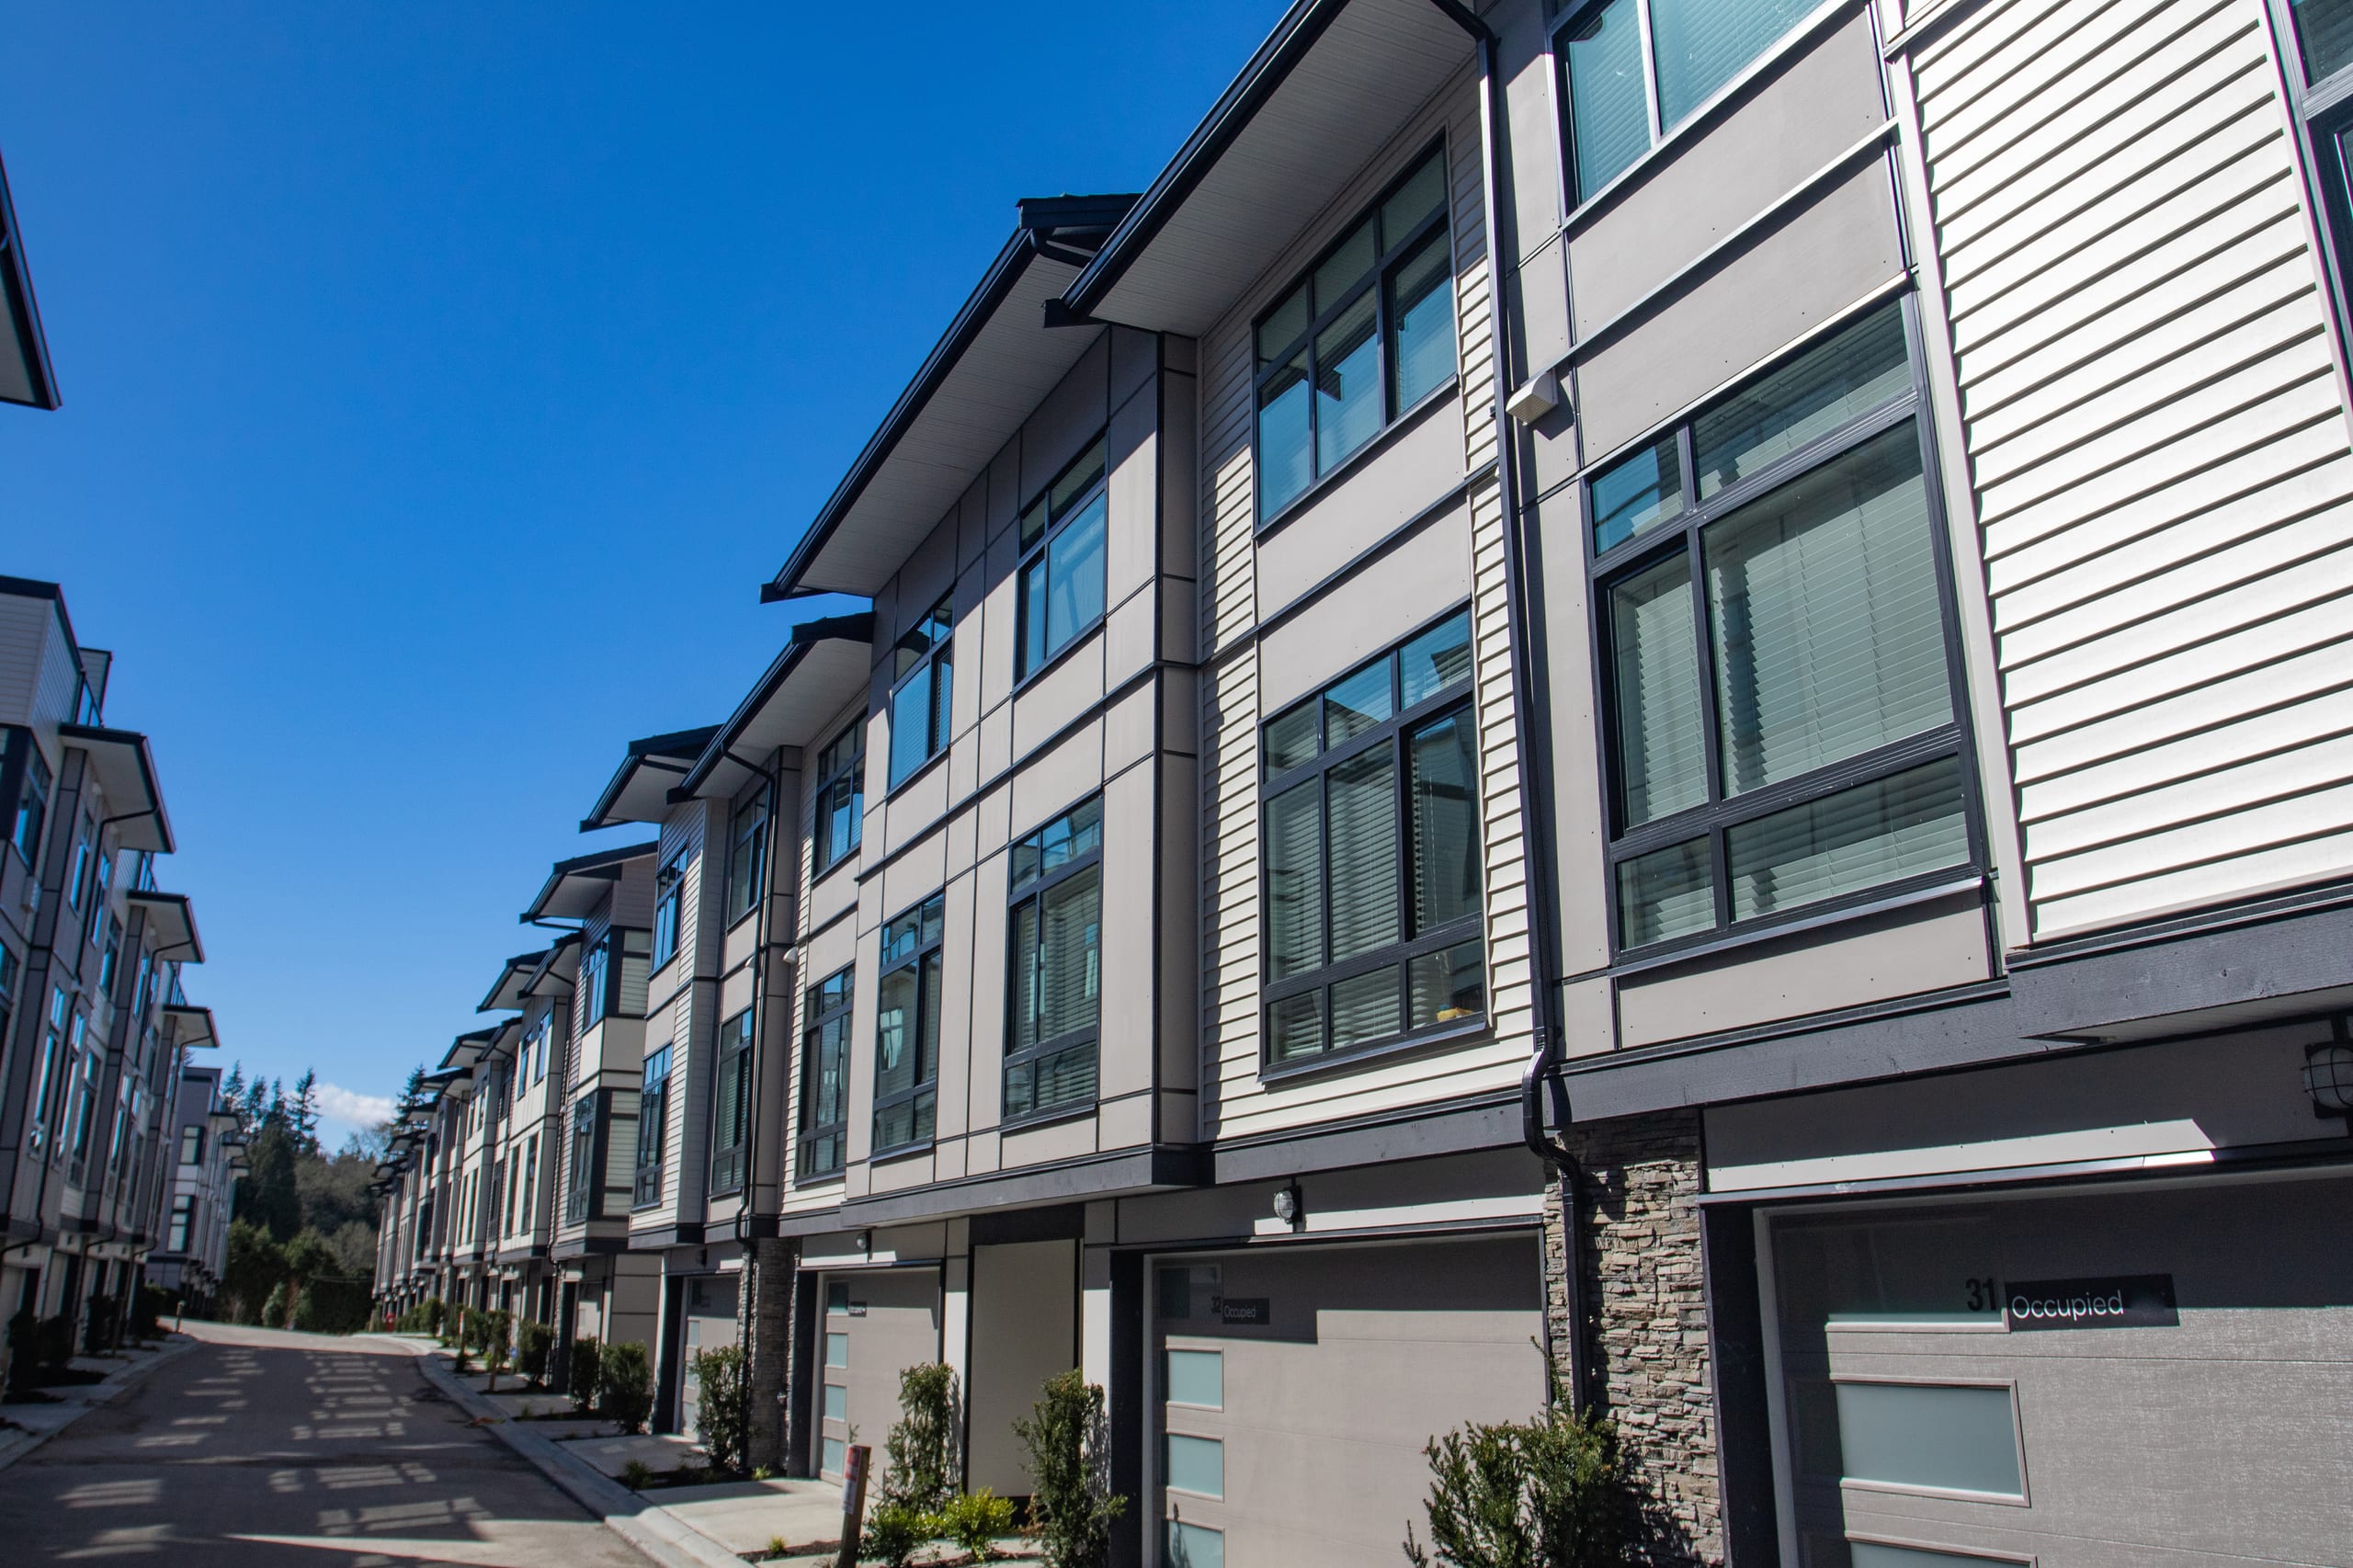
Builders in Metro Vancouver are charging 2.5 per cent less for new houses and townhomes than they did a year ago, and prices in Kelowna and Victoria have fallen to their lowest levels since 2021, according to Statistics Canada figures released Wednesday.
Statistics Canada's New Housing Price Index for Vancouver fell 0.5 per cent from September to October, giving back most of a rare increase the month before. The index now stands 5.1 per cent below its July 2022 peak, just above the low it reached in August.
The index tracks what builders charge for new single-detached homes, semi-detached homes and townhomes with the same specifications from month to month. It excludes sales taxes, and it does not cover condominium apartments, which make up most new housing built in Vancouver.
Both the house and the land are getting cheaper
Statistics Canada splits each price into the cost of the house and the cost of the land under it. In Vancouver, builders' estimated house costs were down 3.1 per cent from October 2025, and land values were down 1.8 per cent. Across B.C. the pattern was the same: house costs fell 3.2 per cent and land 1.7 per cent, for an overall decline of 2.5 per cent.
Kelowna and Victoria fall further
Kelowna had the steepest decline in the province. New-home prices there were down 3.1 per cent from a year earlier, and the index has not risen in any month since September 2025. At 6.7 per cent below its July 2022 peak, it is at its lowest level since the spring of 2021.
In Victoria, prices fell for a fourth straight month, down 0.5 per cent in October and 2.5 per cent from a year earlier. Victoria's index is now 5.3 per cent below its March 2022 high and at its lowest since the fall of 2021.
A national slide led by Ontario and B.C.
Nationally, new-home prices fell 0.2 per cent in October, the eighth monthly decline in a row, and were down 1.9 per cent from a year earlier. Prices fell year over year in 17 of the 27 metropolitan areas the survey covers.
The biggest annual declines were in Toronto (4.3 per cent), Hamilton (4.2 per cent) and Oshawa (3.6 per cent), followed by Kelowna. Vancouver and Victoria were tied for the fifth-largest decline. Prices rose in Manitoba, Saskatchewan and Quebec, led by Winnipeg, where the index climbed 3.0 per cent from a year earlier to a record high.
The index measures the contract price agreed between builder and buyer, not the asking price, so it captures discounts written into the contract.
The November figures are due on Dec. 17.
Source: Statistics Canada, New Housing Price Index, October 2026 (table 18-10-0205-01), released Nov. 18, 2026. Changes from peak and month-to-month streaks are ThinkPol calculations from the table.