


Metro Vancouver condo prices edging down in November
Metro Vancouver condo prices are projected to decline in November 2020, a preliminary analysis of housing market data shows.
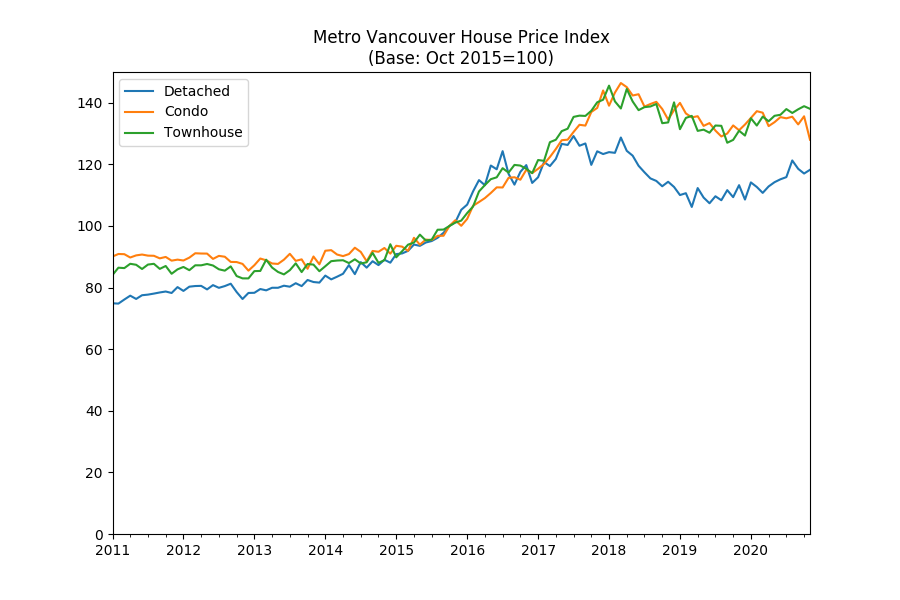
The OpenHousing Home Price Index for condo properties – calculated using the generally-accepted and transparent repeat sales or Case-Shiller method[1]https://faculty.wharton.upenn.edu/wp-content/uploads/2013/05/Brown_2013_House_Price_Index_Methodology_1.pdf – fell 2.35% year-over-year, the November early projection shows. This represents a decrease of 5.62% compared to October.
The OpenHousing Home Price Index covers Vancouver, Richmond, Burnaby, West Vancouver, New Westminster, North Vancouver, Delta, Surrey, Port Moody, Coquitlam, Port Coquitlam, Pitt Meadows, Maple Ridge, Lions Bay, Bower Island, Anmore, and Belcarra, Langley and White Rock. Data for Vancouver also include University British Columbia and University Endowment Lands.
Here’s what condo sales looked like in the last 30 days.
Vancouver
| Address | Sold Price | Assessed | % Δ | True List Price | True List Date | Year Built | Sold Date | Sqft | Price per sqft | Notes |
|---|---|---|---|---|---|---|---|---|---|---|
| 401 1661 E 2ND AVENUE | $900,000 | $908,000 | -0.88 | ? | 31-Jan-2013 | 2014 | 18-Oct-2020 | 854 | $1,053 | |
| 307 1561 W 57TH AVENUE | $760,000 | $774,000 | -1.81 | $899,900 | 29-Jan-2018 | 2018 | 18-Oct-2020 | 673 | $1,129 | |
| 701 1833 CROWE STREET | $1,088,000 | $1,026,000 | 6.04 | $1,199,000 | 05-Nov-2018 | 2009 | 18-Oct-2020 | 1,176 | $925 | |
| 617 3557 SAWMILL CRESCENT | $632,000 | $682,000 | -7.33 | $659,000 | 21-Sep-2020 | 2018 | 18-Oct-2020 | 867 | $728 | |
| 309 2636 E HASTINGS STREET | $475,000 | $442,000 | 7.47 | $474,900 | 05-Oct-2020 | 2009 | 18-Oct-2020 | 697 | $681 | |
| 305 4888 NANAIMO STREET | $457,000 | $403,000 | 13.40 | $459,000 | 16-Oct-2020 | 2012 | 18-Oct-2020 | 477 | $958 | |
| 108 8430 JELLICOE STREET | $410,000 | $375,000 | 9.33 | $449,900 | 28-Sep-2020 | 1994 | 18-Oct-2020 | 685 | $598 | |
| 107 55 E 10TH AVENUE | $880,000 | $856,000 | 2.80 | $899,000 | 30-Sep-2020 | 1994 | 18-Oct-2020 | 851 | $1,034 | Renovated/updated. |
| 2607 1199 SEYMOUR STREET | $840,000 | $897,000 | -6.35 | $949,900 | 22-Jul-2020 | 2005 | 18-Oct-2020 | 823 | $1,020 | Renovated/updated. |
| 606 983 E HASTINGS STREET | $440,000 | $379,000 | 16.09 | $489,000 | 08-Sep-2020 | 2018 | 18-Oct-2020 | 434 | $1,013 | |
| 312 1990 W 6TH AVENUE | $690,000 | $561,100 | 22.97 | $749,000 | 24-Aug-2020 | 1980 | 18-Oct-2020 | 729 | $946 | Renovated/updated. |
| 525 289 E 6TH AVENUE | $866,000 | $851,000 | 1.76 | $899,900 | 13-Oct-2020 | 2015 | 18-Oct-2020 | 849 | $1,020 | |
| 1905 1188 RICHARDS STREET | $660,000 | $674,000 | -2.08 | $675,000 | 14-Oct-2020 | 1995 | 18-Oct-2020 | 642 | $1,028 | Renovated/updated. |
| 1606 821 CAMBIE STREET | $879,000 | $908,000 | -3.19 | ? | 11-Jul-2014 | 2008 | 18-Oct-2020 | 885 | $993 | |
| 2509 602 CITADEL PARADE | $660,000 | $674,000 | -2.08 | $689,000 | 06-Oct-2020 | 2007 | 18-Oct-2020 | 656 | $1,006 | |
| 407 2080 E KENT AVENUE SOUTH | $495,000 | $433,000 | 14.32 | $499,900 | 13-Oct-2020 | 1994 | 18-Oct-2020 | 756 | $654 | Renovated/updated. |
| 103 4990 MCGEER STREET | $387,000 | $330,100 | 17.24 | $439,000 | 31-Jul-2020 | 1994 | 18-Oct-2020 | 558 | $693 | |
| 314 3875 W 4TH AVENUE | $545,000 | $521,400 | 4.53 | $549,000 | 13-Oct-2020 | 1977 | 18-Oct-2020 | 662 | $823 | Renovated/updated. |
| 103 1490 PENNYFARTHING DRIVE | $1,232,500 | $949,000 | 29.87 | $1,280,000 | 13-Oct-2020 | 1986 | 19-Oct-2020 | 1,323 | $931 | Renovated/updated. |
| 512 1238 SEYMOUR STREET | $635,000 | $614,000 | 3.42 | $699,000 | 08-Jun-2020 | 1996 | 19-Oct-2020 | 657 | $966 | |
| 411 251 E 7TH AVENUE | $595,000 | $595,000 | 0.00 | $629,000 | 25-Aug-2020 | 2012 | 19-Oct-2020 | 605 | $983 | |
| 308 2102 W 38TH AVENUE | $690,000 | $602,000 | 14.62 | $728,800 | 23-Jul-2020 | 2000 | 19-Oct-2020 | 767 | $899 | |
| 306 7128 ADERA STREET | $1,470,000 | $1,470,000 | 0.00 | $1,890,000 | 17-Oct-2019 | 2019 | 19-Oct-2020 | 1,253 | $1,173 | |
| 243 2565 W BROADWAY | $812,500 | $733,000 | 10.85 | $820,000 | 09-Oct-2020 | 1995 | 19-Oct-2020 | 868 | $936 | Renovated/updated. |
| 1208 1225 RICHARDS STREET | $730,000 | $637,000 | 14.60 | $798,000 | 21-Sep-2020 | 2003 | 19-Oct-2020 | 635 | $1,149 | Renovated/updated. |
| 317 5983 GRAY AVENUE | $798,000 | $823,000 | -3.04 | $818,000 | 16-Sep-2020 | 2013 | 19-Oct-2020 | 828 | $963 | |
| 1201 1128 QUEBEC STREET | $935,000 | $946,000 | -1.16 | $949,900 | 13-Oct-2020 | 1994 | 19-Oct-2020 | 1,078 | $867 | Renovated/updated. |
| 258 2175 SALAL DRIVE | $1,200,000 | $1,068,000 | 12.36 | $1,199,800 | 19-Oct-2020 | 2000 | 19-Oct-2020 | 1,184 | $1,013 | |
| 1809 3520 CROWLEY DRIVE | $554,000 | $565,000 | -1.95 | $588,000 | 04-Aug-2020 | 2001 | 19-Oct-2020 | 727 | $762 | |
| 302 3463 CROWLEY DRIVE | $545,500 | $498,000 | 9.54 | $599,000 | 19-Jun-2020 | 1995 | 19-Oct-2020 | 848 | $643 | |
| 308 2328 OXFORD STREET | $540,000 | $542,000 | -0.37 | $304,900 | 13-Jun-2011 | 1984 | 19-Oct-2020 | 798 | $676 | |
| 304 2330 MAPLE STREET | $521,000 | $486,400 | 7.11 | $575,000 | 14-Jul-2020 | 1974 | 19-Oct-2020 | 622 | $837 | Renovated/updated. |
| 209 750 E 7TH AVENUE | $358,000 | $395,800 | -9.55 | $349,900 | 27-Sep-2020 | 1974 | 19-Oct-2020 | 596 | $600 | Renovated/updated. |
| 901 930 CAMBIE STREET | $810,000 | $855,000 | -5.26 | $990,000 | 10-Feb-2020 | 1994 | 19-Oct-2020 | 1,105 | $733 | |
| 310 161 W GEORGIA STREET | $652,000 | $657,000 | -0.76 | $669,000 | 29-Sep-2020 | 2012 | 19-Oct-2020 | 693 | $940 | Renovated/updated. |
| 1101 1788 W GEORGIA STREET | $1,289,000 | $1,197,000 | 7.69 | $1,269,000 | 14-Oct-2020 | 1990 | 19-Oct-2020 | 1,369 | $941 | |
| 2905 198 AQUARIUS MEWS | $669,000 | $630,000 | 6.19 | $689,000 | 22-Sep-2020 | 1999 | 19-Oct-2020 | 526 | $1,271 | |
| 704 1575 W 10TH AVENUE | $944,000 | $944,000 | 0.00 | $998,000 | 27-Jul-2020 | 1998 | 19-Oct-2020 | 1,240 | $761 | |
| 306 638 BEACH CRESCENT | $667,000 | $666,000 | 0.15 | $729,900 | 31-Aug-2020 | 2006 | 20-Oct-2020 | 642 | $1,038 | |
| 405 138 W 6TH AVENUE | $875,000 | $775,000 | 12.90 | ? | 26-Oct-2010 | 1996 | 20-Oct-2020 | 1,092 | $801 | Renovated/updated. |
| 311 1823 E GEORGIA STREET | $725,000 | $666,000 | 8.86 | $749,800 | 14-Oct-2020 | 1992 | 20-Oct-2020 | 787 | $921 | Renovated/updated. |
| 1801 918 COOPERAGE WAY | $685,000 | $687,000 | -0.29 | $749,000 | 28-Sep-2020 | 2008 | 20-Oct-2020 | 664 | $1,031 | |
| 102 5760 HAMPTON PLACE | $1,030,000 | $941,000 | 9.46 | $999,000 | 21-Sep-2020 | 1993 | 20-Oct-2020 | 1,403 | $734 | |
| 301 2268 REDBUD LANE | $685,000 | $581,000 | 17.90 | $649,000 | 16-Oct-2020 | 1998 | 20-Oct-2020 | 605 | $1,132 | |
| 1601 888 HOMER STREET | $1,052,000 | $917,000 | 14.72 | $999,000 | 13-Oct-2020 | 2011 | 20-Oct-2020 | 970 | $1,084 | |
| 303 138 TEMPLETON DRIVE | $525,000 | $397,100 | 32.21 | $499,000 | 14-Oct-2020 | 1973 | 20-Oct-2020 | 590 | $889 | Renovated/updated. |
| 316 933 SEYMOUR STREET | $570,000 | $532,000 | 7.14 | $598,000 | 13-Jul-2020 | 1998 | 20-Oct-2020 | 663 | $859 | |
| 909 939 HOMER STREET | $722,000 | $657,000 | 9.89 | $769,000 | 24-Aug-2020 | 1998 | 20-Oct-2020 | 771 | $936 | Renovated/updated. |
| 311 3788 W 8TH AVENUE | $964,380 | $973,000 | -0.89 | $999,999 | 29-Sep-2020 | 1989 | 20-Oct-2020 | 1,101 | $875 | |
| 110 321 E 16TH AVENUE | $622,000 | $577,000 | 7.80 | $624,900 | 09-Oct-2020 | 2019 | 20-Oct-2020 | 574 | $1,083 | |
| 1803 1281 W CORDOVA STREET | $2,155,000 | $2,319,000 | -7.07 | $1,999,000 | 04-Sep-2020 | 2004 | 20-Oct-2020 | 1,253 | $1,719 | |
| 205 1318 W 6TH AVENUE | $950,000 | $1,047,000 | -9.26 | $899,000 | 15-Oct-2020 | 1992 | 21-Oct-2020 | 1,350 | $703 | |
| 104 2333 ETON STREET | $512,500 | $547,000 | -6.31 | $548,000 | 31-Aug-2020 | 1988 | 21-Oct-2020 | 719 | $712 | |
| 601 233 ABBOTT STREET | $535,000 | $521,000 | 2.69 | $549,000 | 13-Oct-2020 | 1911 | 21-Oct-2020 | 600 | $891 | |
| 401 2108 W 38TH AVENUE | $899,000 | $852,000 | 5.52 | $899,000 | 19-Oct-2020 | 1992 | 21-Oct-2020 | 1,234 | $728 | |
| 1407 445 W 2ND AVENUE | $636,000 | $639,000 | -0.47 | $683,000 | 28-Apr-2020 | 2012 | 21-Oct-2020 | 561 | $1,133 | |
| 308 2028 W 11TH AVENUE | $798,000 | $665,000 | 20.00 | $875,000 | 10-Aug-2020 | 1996 | 21-Oct-2020 | 886 | $900 | Renovated/updated. |
| 202 1178 HAMILTON STREET | $580,000 | $496,000 | 16.94 | $599,000 | 08-Sep-2020 | 1913 | 21-Oct-2020 | 530 | $1,094 | Renovated/updated. |
| 202 12 ATHLETES WAY | $650,000 | $712,000 | -8.71 | $799,000 | 07-Sep-2020 | 2009 | 21-Oct-2020 | 710 | $915 | Renovated/updated. |
| 301 1128 QUEBEC STREET | $900,000 | $925,000 | -2.70 | $1,089,000 | 09-Mar-2020 | 1994 | 21-Oct-2020 | 1,236 | $728 | Renovated/updated. |
| 301 2211 WALL STREET | $715,000 | $681,000 | 4.99 | $719,000 | 14-Oct-2020 | 1994 | 21-Oct-2020 | 917 | $779 | Renovated/updated. |
| 2403 588 BROUGHTON STREET | $773,300 | $765,000 | 1.08 | $799,000 | 16-Oct-2020 | 1995 | 21-Oct-2020 | 589 | $1,312 | |
| 101 555 W 14TH AVENUE | $440,000 | $330,900 | 32.97 | $449,000 | 14-Oct-2020 | 1984 | 21-Oct-2020 | 442 | $995 | Renovated/updated. |
| 3302 1308 HORNBY STREET | $2,335,000 | $2,041,000 | 14.40 | $3,016,500 | 26-May-2020 | 2014 | 21-Oct-2020 | 1,384 | $1,687 | |
| 2009 939 EXPO BOULEVARD | $615,000 | $591,000 | 4.06 | $669,000 | 26-Aug-2020 | 2005 | 21-Oct-2020 | 506 | $1,215 | |
| 208 334 E 5TH AVENUE | $495,000 | $479,500 | 3.23 | $499,000 | 13-Oct-2020 | 1977 | 21-Oct-2020 | 708 | $699 | Renovated/updated. |
| 305 1252 HORNBY STREET | $673,000 | $638,000 | 5.49 | $698,800 | 16-Sep-2020 | 2008 | 22-Oct-2020 | 651 | $1,033 | Renovated/updated. |
| 1106 638 BEACH CRESCENT | $729,000 | $736,000 | -0.95 | $788,000 | 18-Feb-2020 | 2006 | 22-Oct-2020 | 664 | $1,097 | |
| 2306 1495 RICHARDS STREET | $875,000 | $849,000 | 3.06 | $888,000 | 30-Sep-2020 | 2004 | 22-Oct-2020 | 775 | $1,129 | |
| 401 1690 W 8TH AVENUE | $988,000 | $1,005,000 | -1.69 | $1,088,000 | 29-Oct-2019 | 2008 | 22-Oct-2020 | 1,008 | $980 | |
| 509 2268 REDBUD LANE | $845,000 | $764,000 | 10.60 | $849,000 | 19-Oct-2020 | 1998 | 22-Oct-2020 | 827 | $1,021 | |
| 1602 1723 ALBERNI STREET | $841,000 | $834,000 | 0.84 | $879,900 | 07-Oct-2020 | 1998 | 22-Oct-2020 | 780 | $1,078 | |
| 305 819 HAMILTON STREET | $475,000 | $408,000 | 16.42 | $479,000 | 07-Oct-2020 | 1998 | 22-Oct-2020 | 405 | $1,172 | |
| 201 1251 W 71ST AVENUE | $513,000 | $474,000 | 8.23 | $538,000 | 03-Oct-2020 | 1982 | 22-Oct-2020 | 838 | $612 | |
| 1B 1500 ALBERNI STREET | $1,195,000 | $1,075,000 | 11.16 | $1,198,000 | 09-Sep-2020 | 1991 | 22-Oct-2020 | 1,360 | $878 | Renovated/updated. |
| 2805 1308 HORNBY STREET | $561,000 | $558,000 | 0.54 | $668,000 | 15-Oct-2018 | 2014 | 22-Oct-2020 | 471 | $1,191 | |
| 505 55 E CORDOVA STREET | $840,000 | $800,000 | 5.00 | $875,000 | 27-Aug-2020 | 2006 | 23-Oct-2020 | 986 | $851 | |
| 402 1550 W 15TH AVENUE | $1,575,000 | $1,533,000 | 2.74 | $1,699,900 | 08-Sep-2020 | 1993 | 23-Oct-2020 | 1,531 | $1,028 | |
| 2802 233 ROBSON STREET | $1,095,000 | $983,000 | 11.39 | $1,188,800 | 22-Sep-2020 | 2009 | 23-Oct-2020 | 959 | $1,141 | |
| 306 683 E 27TH AVENUE | $585,000 | $535,000 | 9.35 | $615,000 | 21-Sep-2020 | 2012 | 23-Oct-2020 | 565 | $1,035 | |
| 516 428 W 8TH AVENUE | $799,000 | $789,000 | 1.27 | $819,000 | 08-Sep-2020 | 1999 | 23-Oct-2020 | 827 | $966 | Renovated/updated. |
| 1208 1205 HOWE STREET | $620,000 | $657,000 | -5.63 | ? | 18-Aug-2012 | 2009 | 23-Oct-2020 | 662 | $936 | Renovated/updated. |
| 1005 5288 MELBOURNE STREET | $680,000 | $658,000 | 3.34 | $685,000 | 13-Oct-2020 | 1998 | 23-Oct-2020 | 1,020 | $666 | Renovated/updated. |
| 102 444 E 6TH AVENUE | $655,000 | $639,000 | 2.50 | $680,000 | 29-Sep-2020 | 1974 | 23-Oct-2020 | 975 | $671 | Renovated/updated. |
| 512 6633 CAMBIE STREET | $590,000 | $604,000 | -2.32 | $763,000 | 02-Sep-2020 | 2016 | 23-Oct-2020 | 592 | $996 | |
| 606 6383 CAMBIE STREET | $660,000 | $672,000 | -1.79 | $699,000 | 07-Oct-2020 | 2015 | 23-Oct-2020 | 573 | $1,151 | |
| 403 310 WATER STREET | $580,000 | $631,000 | -8.08 | $699,000 | 01-Apr-2019 | 1911 | 23-Oct-2020 | 729 | $795 | |
| 302 1729 E GEORGIA STREET | $489,000 | $551,000 | -11.25 | $498,000 | 30-Sep-2020 | 1993 | 23-Oct-2020 | 667 | $733 | Renovated/updated. |
| 305 370 CARRALL STREET | $413,000 | $420,000 | -1.67 | $430,000 | 01-Sep-2020 | 1983 | 24-Oct-2020 | 385 | $1,072 | |
| 312 38 W 1ST AVENUE | $690,000 | $619,000 | 11.47 | $699,999 | 06-Oct-2020 | 2015 | 24-Oct-2020 | 604 | $1,142 | |
| 208 3333 MAIN STREET | $690,000 | $635,000 | 8.66 | $699,900 | 17-Sep-2020 | 2011 | 24-Oct-2020 | 716 | $963 | |
| 705 1330 HORNBY STREET | $410,000 | $414,000 | -0.97 | $449,000 | 11-Aug-2020 | 1986 | 25-Oct-2020 | 408 | $1,004 | Renovated/updated. |
| 206 1545 E 2ND AVENUE | $360,000 | $381,400 | -5.61 | $409,900 | 20-Nov-2019 | 1976 | 25-Oct-2020 | 456 | $789 | Renovated/updated. |
| 202 888 BUTE STREET | $815,000 | $803,000 | 1.49 | $829,900 | 04-Aug-2020 | 1994 | 25-Oct-2020 | 916 | $889 | Renovated/updated. |
| 302 933 E HASTINGS STREET | $695,000 | $648,000 | 7.25 | $699,900 | 14-Oct-2020 | 2018 | 25-Oct-2020 | 800 | $868 | Renovated/updated. |
| 703 1783 MANITOBA STREET | $700,000 | $703,000 | -0.43 | ? | 08-Aug-2012 | 2015 | 25-Oct-2020 | 712 | $983 | |
| 309 22 E CORDOVA STREET | $395,000 | $373,500 | 5.76 | $408,000 | 23-Sep-2020 | 1996 | 25-Oct-2020 | 408 | $968 | Renovated/updated. |
| 1603 1189 HOWE STREET | $554,388 | $504,000 | 10.00 | $510,000 | 30-Jul-2020 | 1998 | 25-Oct-2020 | 568 | $976 | |
| 103 738 E 29TH AVENUE | $570,000 | $620,000 | -8.06 | $315,000 | 25-Aug-2020 | 2011 | 25-Oct-2020 | 726 | $785 | |
| 216 405 SKEENA STREET | $565,000 | $534,000 | 5.81 | $569,000 | 08-Oct-2020 | 2008 | 25-Oct-2020 | 826 | $684 | |
| 504 977 MAINLAND STREET | $570,000 | $521,000 | 9.40 | $589,900 | 13-Oct-2020 | 2006 | 25-Oct-2020 | 492 | $1,158 | |
| 716 188 KEEFER STREET | $495,000 | $602,000 | -17.77 | $558,000 | 24-Feb-2020 | 2016 | 25-Oct-2020 | 585 | $846 | |
| 206 288 E 14TH AVENUE | $480,000 | $412,000 | 16.50 | $499,900 | 21-Sep-2020 | 1983 | 25-Oct-2020 | 500 | $960 | |
| 1408 1288 W GEORGIA STREET | $785,000 | $793,000 | -1.01 | $875,000 | 14-Sep-2020 | 1998 | 25-Oct-2020 | 847 | $926 | |
| 505 193 AQUARIUS MEWS | $640,000 | $618,000 | 3.56 | $710,000 | 02-Sep-2020 | 2000 | 25-Oct-2020 | 628 | $1,019 | |
| 406 1178 HAMILTON STREET | $715,000 | $693,000 | 3.17 | $719,900 | 08-Oct-2020 | 1913 | 25-Oct-2020 | 707 | $1,011 | |
| 602 3438 VANNESS AVENUE | $349,500 | $304,000 | 14.97 | $379,900 | 06-Oct-2020 | 1998 | 25-Oct-2020 | 435 | $803 | Renovated/updated. |
| 202 4888 NANAIMO STREET | $480,000 | $455,000 | 5.49 | $518,000 | 04-Sep-2020 | 2012 | 25-Oct-2020 | 548 | $875 | |
| 702 850 BURRARD STREET | $642,000 | $569,000 | 12.83 | $659,000 | 20-Oct-2020 | 1983 | 26-Oct-2020 | 674 | $952 | |
| 4 2088 W 11TH AVENUE | $927,000 | $804,000 | 15.30 | $899,000 | 28-Jan-2019 | 2000 | 26-Oct-2020 | 914 | $1,014 | |
| 307 2080 E KENT AVENUE | $440,000 | $426,000 | 3.29 | $449,900 | 23-Oct-2020 | 1994 | 26-Oct-2020 | 719 | $611 | |
| 219 2768 CRANBERRY DRIVE | $829,000 | $773,000 | 7.24 | $829,000 | 13-Oct-2020 | 2000 | 26-Oct-2020 | 895 | $926 | |
| 413 2929 W 4TH AVENUE | $840,000 | $841,000 | -0.12 | $899,900 | 21-Sep-2020 | 1998 | 26-Oct-2020 | 964 | $871 | Renovated/updated. |
| 1802 989 NELSON STREET | $627,000 | $658,000 | -4.71 | $659,000 | 20-Aug-2020 | 1957 | 26-Oct-2020 | 660 | $950 | |
| 310 4355 W 10TH AVENUE | $711,000 | $701,000 | 1.43 | $699,000 | 19-Oct-2020 | 2012 | 26-Oct-2020 | 649 | $1,095 | |
| 412 2511 QUEBEC STREET | $555,000 | $534,000 | 3.93 | $539,000 | 19-Oct-2020 | 2011 | 26-Oct-2020 | 627 | $885 | Renovated/updated. |
| 106 1551 W 11TH AVENUE | $575,000 | $539,300 | 6.62 | $619,000 | 02-Sep-2020 | 1980 | 26-Oct-2020 | 707 | $813 | Renovated/updated. |
| 1902 939 HOMER STREET | $745,500 | $675,000 | 10.44 | $749,900 | 21-Oct-2020 | 1998 | 26-Oct-2020 | 771 | $966 | |
| 309 1333 W 7TH AVENUE | $830,000 | $669,000 | 24.07 | $845,000 | 19-Oct-2020 | 1993 | 26-Oct-2020 | 889 | $933 | Renovated/updated. |
| 203 3456 COMMERCIAL STREET | $640,000 | $574,000 | 11.50 | $635,000 | 21-Oct-2020 | 2015 | 26-Oct-2020 | 655 | $977 | |
| 209 928 RICHARDS STREET | $782,000 | $719,000 | 8.76 | $818,000 | 25-Aug-2020 | 2000 | 26-Oct-2020 | 823 | $950 | Renovated/updated. |
| 317 2220 KINGSWAY | $457,500 | $464,000 | -1.40 | $425,000 | 26-Apr-2017 | 2018 | 26-Oct-2020 | 517 | $884 | |
| 402 1515 E 6TH AVENUE | $765,000 | $764,000 | 0.13 | $699,000 | 22-Oct-2020 | 1991 | 26-Oct-2020 | 837 | $913 | |
| 1508 989 BEATTY STREET | $490,000 | $474,000 | 3.38 | $589,000 | 21-Jan-2019 | 2004 | 27-Oct-2020 | 455 | $1,076 | |
| 1809 939 EXPO BOULEVARD | $585,000 | $582,000 | 0.52 | $599,900 | 26-Aug-2020 | 2005 | 27-Oct-2020 | 506 | $1,156 | |
| 201 1450 E 7TH AVENUE | $551,500 | $574,000 | -3.92 | $575,000 | 28-Sep-2020 | 1983 | 27-Oct-2020 | 757 | $728 | Renovated/updated. |
| 425 2008 PINE STREET | $696,000 | $626,000 | 11.18 | $724,900 | 10-Sep-2020 | 2009 | 27-Oct-2020 | 662 | $1,051 | |
| 208 1811 W 16TH AVENUE | $1,354,000 | $1,288,000 | 5.12 | $1,349,000 | 05-Oct-2020 | 1922 | 27-Oct-2020 | 1,315 | $1,029 | Renovated/updated. |
| 212 2468 BAYSWATER STREET | $1,305,000 | $1,118,000 | 16.73 | $1,189,000 | 21-Oct-2020 | 2014 | 27-Oct-2020 | 1,002 | $1,302 | |
| 204 5350 BALSAM STREET | $655,000 | $587,000 | 11.58 | $699,000 | 13-Oct-2020 | 1973 | 27-Oct-2020 | 1,115 | $587 | Renovated/updated. |
| 910 3281 E KENT AVENUE NORTH | $660,000 | $645,000 | 2.33 | $698,000 | 22-Jul-2020 | 2016 | 27-Oct-2020 | 930 | $709 | |
| 3101 5515 BOUNDARY ROAD | $750,000 | $716,000 | 4.75 | $779,900 | 09-Jul-2020 | 2016 | 27-Oct-2020 | 767 | $977 | |
| 403 989 RICHARDS STREET | $810,000 | $756,000 | 7.14 | $968,000 | 19-Jun-2020 | 2000 | 27-Oct-2020 | 855 | $947 | Renovated/updated. |
| 112 1082 W 8TH AVENUE | $526,000 | $531,200 | -0.98 | $608,800 | 17-Aug-2020 | 1985 | 27-Oct-2020 | 661 | $795 | Renovated/updated. |
| 309 1990 W 6TH AVENUE | $595,000 | $566,000 | 5.12 | $618,000 | 28-Sep-2020 | 1980 | 27-Oct-2020 | 736 | $808 | Renovated/updated. |
| 802 638 BEACH CRESCENT | $1,400,000 | $1,335,000 | 4.87 | $1,400,000 | 26-Oct-2020 | 2006 | 27-Oct-2020 | 1,084 | $1,291 | |
| 3101 688 ABBOTT STREET | $888,000 | $920,000 | -3.48 | $938,888 | 08-Nov-2019 | 2007 | 27-Oct-2020 | 951 | $933 | Renovated/updated. |
| 706 1308 HORNBY STREET | $667,500 | $672,000 | -0.67 | $729,000 | 14-Sep-2020 | 2014 | 27-Oct-2020 | 654 | $1,020 | |
| 216 1549 KITCHENER STREET | $440,000 | $468,500 | -6.08 | $498,000 | 20-Jul-2020 | 1978 | 28-Oct-2020 | 618 | $711 | Renovated/updated. |
| 512 22 E CORDOVA STREET | $631,500 | $625,000 | 1.04 | $678,000 | 17-Apr-2020 | 1996 | 28-Oct-2020 | 820 | $770 | Renovated/updated. |
| 510 110 SWITCHMEN STREET | $830,000 | $790,000 | 5.06 | $875,000 | 13-Oct-2020 | 2014 | 28-Oct-2020 | 781 | $1,062 | |
| 1003 5288 MELBOURNE STREET | $513,000 | $530,000 | -3.21 | $539,990 | 17-Sep-2020 | 1998 | 28-Oct-2020 | 740 | $693 | Renovated/updated. |
| 2002 989 NELSON STREET | $679,800 | $670,000 | 1.46 | $758,000 | 16-Jun-2020 | 1957 | 28-Oct-2020 | 660 | $1,030 | Renovated/updated. |
| 301 4900 CARTIER STREET | $1,150,000 | $1,057,000 | 8.80 | $1,100,000 | 21-Oct-2020 | 1976 | 28-Oct-2020 | 1,244 | $924 | Renovated/updated. |
| 3105 1111 ALBERNI STREET | $1,532,500 | $1,659,000 | -7.63 | $1,549,000 | 21-Oct-2020 | 2008 | 28-Oct-2020 | 1,084 | $1,413 | |
| 1408 1775 QUEBEC STREET | $650,000 | $585,000 | 11.11 | $679,900 | 21-Oct-2020 | 2014 | 28-Oct-2020 | 526 | $1,235 | |
| 805 1155 SEYMOUR STREET | $660,000 | $607,000 | 8.73 | $668,000 | 21-Oct-2020 | 2005 | 29-Oct-2020 | 607 | $1,087 | |
| 42 777 BURRARD STREET | $535,000 | $470,000 | 13.83 | $549,900 | 30-Sep-2020 | 1912 | 29-Oct-2020 | 606 | $882 | Renovated/updated. |
| 705 6311 CAMBIE STREET | $1,293,800 | $1,283,000 | 0.84 | $1,338,000 | 20-Oct-2020 | 2014 | 29-Oct-2020 | 1,121 | $1,154 | |
| 2010 1283 HOWE STREET | $710,000 | $719,000 | -1.25 | $719,000 | 26-Oct-2020 | 2019 | 29-Oct-2020 | 622 | $1,141 | |
| 403 2588 ALDER STREET | $780,000 | $642,000 | 21.50 | $799,000 | 08-Sep-2020 | 1996 | 29-Oct-2020 | 780 | $1,000 | |
| 602 5665 BOUNDARY ROAD | $580,000 | $586,000 | -1.02 | $588,000 | 27-Jul-2020 | 2016 | 29-Oct-2020 | 675 | $859 | |
| 1817 938 SMITHE STREET | $670,000 | $627,000 | 6.86 | $688,000 | 01-Mar-2017 | 2005 | 29-Oct-2020 | 608 | $1,101 | |
| 1507 977 MAINLAND STREET | $618,000 | $626,000 | -1.28 | $599,000 | 19-Jun-2020 | 2006 | 29-Oct-2020 | 561 | $1,101 | |
| 312 1082 SEYMOUR STREET | $500,000 | $482,000 | 3.73 | $499,000 | 19-Oct-2020 | 2006 | 29-Oct-2020 | 494 | $1,012 | |
| 206 222 E 30TH AVENUE | $885,000 | $794,000 | 11.46 | $918,900 | 14-Sep-2020 | 2012 | 29-Oct-2020 | 958 | $923 | |
| 413 3333 MAIN STREET | $910,000 | $853,000 | 6.68 | $899,000 | 27-Oct-2020 | 2011 | 29-Oct-2020 | 900 | $1,011 | Renovated/updated. |
| 308 1958 E 47TH AVENUE | $519,000 | $446,000 | 16.37 | $525,000 | 20-Aug-2020 | 1993 | 29-Oct-2020 | 879 | $590 | Renovated/updated. |
| 202 683 E 27TH AVENUE | $589,000 | $641,000 | -8.11 | ? | 20-May-2013 | 2012 | 30-Oct-2020 | 693 | $849 | |
| 601 1159 MAIN STREET | $757,000 | $822,000 | -7.91 | $799,000 | 21-Sep-2020 | 1992 | 30-Oct-2020 | 1,270 | $596 | Renovated/updated. |
| 416 1988 MAPLE STREET | $1,206,100 | $805,000 | 49.83 | $999,000 | 23-Oct-2020 | 1988 | 30-Oct-2020 | 950 | $1,269 | Renovated/updated. |
| 802 928 RICHARDS STREET | $535,000 | $504,000 | 6.15 | $568,000 | 12-Sep-2020 | 2000 | 30-Oct-2020 | 495 | $1,080 | |
| 105 685 W 7TH AVENUE | $637,950 | $565,000 | 12.91 | $625,000 | 28-Oct-2020 | 1996 | 30-Oct-2020 | 666 | $957 | Renovated/updated. |
| 402 1159 MAIN STREET | $780,000 | $708,000 | 10.17 | $785,000 | 20-Oct-2020 | 1992 | 30-Oct-2020 | 1,146 | $680 | Renovated/updated. |
| 911 181 W 1ST AVENUE | $820,000 | $786,000 | 4.33 | $819,900 | 26-Oct-2020 | 2009 | 31-Oct-2020 | 775 | $1,058 | |
| 204 1530 MARINER WALK | $500,000 | $512,000 | -2.34 | $499,900 | 12-Oct-2020 | 1984 | 31-Oct-2020 | 889 | $562 | Renovated/updated. |
| 215 1869 SPYGLASS PLACE | $1,150,000 | $1,028,000 | 11.87 | $1,150,000 | 30-Oct-2020 | 1988 | 31-Oct-2020 | 1,121 | $1,025 | |
| 1006 930 CAMBIE STREET | $917,000 | $836,000 | 9.69 | $929,999 | 12-Oct-2020 | 1994 | 31-Oct-2020 | 1,099 | $834 | Renovated/updated. |
| 403 379 E BROADWAY | $607,000 | $585,000 | 3.76 | $659,000 | 01-Apr-2020 | 2018 | 31-Oct-2020 | 515 | $1,178 | Renovated/updated. |
| 1502 1189 HOWE STREET | $699,000 | $656,000 | 6.55 | $799,000 | 17-Mar-2020 | 1998 | 31-Oct-2020 | 791 | $883 | |
| 908 1331 ALBERNI STREET | $476,000 | $480,000 | -0.83 | $499,000 | 07-May-2020 | 1999 | 31-Oct-2020 | 446 | $1,067 | |
| 804 66 W CORDOVA STREET | $649,900 | $563,000 | 15.44 | $649,900 | 26-Oct-2020 | 2012 | 31-Oct-2020 | 808 | $804 | Renovated/updated. |
| 1806 1775 QUEBEC STREET | $870,000 | $851,000 | 2.23 | $899,000 | 10-Jul-2020 | 2014 | 31-Oct-2020 | 812 | $1,071 | |
| 502 38 W 1ST AVENUE | $929,000 | $896,000 | 3.68 | $958,000 | 25-May-2020 | 2015 | 31-Oct-2020 | 890 | $1,043 | |
| 1207 1238 SEYMOUR STREET | $458,000 | $418,000 | 9.57 | $558,000 | 09-Sep-2020 | 1996 | 31-Oct-2020 | 468 | $978 | Renovated/updated. |
| 193 WALTER HARDWICK AVENUE | $562,000 | $574,000 | -2.09 | $568,000 | 27-Oct-2020 | 2009 | 01-Nov-2020 | 484 | $1,161 | |
| 1502 188 KEEFER PLACE | $835,000 | $803,000 | 3.99 | $925,000 | 16-Sep-2020 | 2009 | 01-Nov-2020 | 889 | $939 | Renovated/updated. |
| 201 868 W 16TH AVENUE | $875,000 | $782,000 | 11.89 | $880,000 | 13-Oct-2020 | 1992 | 01-Nov-2020 | 1,011 | $865 | |
| 910 939 HOMER STREET | $460,000 | $436,000 | 5.50 | $488,000 | 28-Oct-2020 | 1998 | 01-Nov-2020 | 443 | $1,038 | |
| 1102 518 MOBERLY ROAD | $1,168,000 | $988,000 | 18.22 | $1,220,000 | 10-Sep-2020 | 1986 | 01-Nov-2020 | 1,223 | $955 | |
| 207 830 E 7TH AVENUE | $314,000 | $289,900 | 8.31 | $348,000 | 15-Oct-2020 | 1975 | 01-Nov-2020 | 426 | $737 | Renovated/updated. |
| 3109 128 W CORDOVA STREET | $561,500 | $556,000 | 0.99 | $615,000 | 11-May-2020 | 2009 | 01-Nov-2020 | 559 | $1,004 | |
| 602 1488 HORNBY STREET | $1,275,000 | $1,253,000 | 1.76 | $1,498,800 | 11-Aug-2020 | 1994 | 01-Nov-2020 | 1,498 | $851 | Renovated/updated. |
| 410 251 E 7TH AVENUE | $610,000 | $546,000 | 11.72 | $609,900 | 27-Oct-2020 | 2012 | 01-Nov-2020 | 642 | $950 | |
| 301 1220 W 6TH AVENUE | $1,023,000 | $1,131,000 | -9.55 | $1,398,000 | 17-Mar-2020 | 1982 | 02-Nov-2020 | 1,340 | $763 | Renovated/updated. |
| 2603 1211 MELVILLE STREET | $1,165,000 | $1,083,000 | 7.57 | $1,157,000 | 02-Nov-2020 | 2008 | 02-Nov-2020 | 856 | $1,360 | Renovated/updated. |
| 11B 1568 W 12TH AVENUE | $1,400,000 | $1,243,000 | 12.63 | $1,499,000 | 22-Sep-2020 | 1981 | 02-Nov-2020 | 2,087 | $670 | |
| 206 2388 TRIUMPH STREET | $491,000 | $459,000 | 6.97 | $484,000 | 28-Oct-2020 | 1993 | 02-Nov-2020 | 596 | $823 | |
| 1002 445 W 2ND AVENUE | $639,000 | $662,000 | -3.47 | $718,000 | 03-Jul-2020 | 2012 | 02-Nov-2020 | 615 | $1,039 | Brand New. |
| 506 1833 CROWE STREET | $929,000 | $909,000 | 2.20 | $948,800 | 22-Jul-2020 | 2009 | 02-Nov-2020 | 1,025 | $906 | |
| 344 2033 TRIUMPH STREET | $475,000 | $466,100 | 1.91 | ? | 07-Oct-2014 | 1975 | 02-Nov-2020 | 687 | $691 | Renovated/updated. |
| 208 607 E 8TH AVENUE | $580,000 | $424,500 | 36.63 | $574,900 | 26-Oct-2020 | 1982 | 02-Nov-2020 | 671 | $864 | Renovated/updated. |
| 811 3557 SAWMILL CRESCENT | $569,000 | $535,000 | 6.36 | $569,000 | 03-Nov-2020 | 2018 | 03-Nov-2020 | 677 | $840 | |
| 310 2405 KAMLOOPS STREET | $512,500 | $468,000 | 9.51 | $528,800 | 30-Sep-2020 | 1995 | 03-Nov-2020 | 804 | $637 | |
| 1706 1239 W GEORGIA STREET | $475,000 | $524,000 | -9.35 | $595,000 | 18-Aug-2020 | 1999 | 03-Nov-2020 | 442 | $1,074 | |
| 1101 1500 HARO STREET | $821,500 | $850,000 | -3.35 | $829,000 | 02-Nov-2020 | 1978 | 03-Nov-2020 | 990 | $829 | Renovated/updated. |
| 2104 5515 BOUNDARY ROAD | $557,000 | $558,000 | -0.18 | $585,000 | 19-Oct-2020 | 2016 | 03-Nov-2020 | 594 | $937 | |
| 208 1106 PACIFIC STREET | $438,000 | $497,000 | -11.87 | $549,000 | 30-Aug-2019 | 1984 | 04-Nov-2020 | 552 | $793 | Renovated/updated. |
| 304 334 E 5TH AVENUE | $365,000 | $305,400 | 19.52 | $379,000 | 13-Oct-2020 | 1977 | 04-Nov-2020 | 424 | $860 | Renovated/updated. |
| 506 1003 PACIFIC STREET | $560,000 | $525,000 | 6.67 | $579,000 | 10-Sep-2020 | 1997 | 04-Nov-2020 | 652 | $858 | |
| 1301 1499 W PENDER STREET | $1,750,000 | $1,651,000 | 6.00 | $1,895,000 | 04-Jun-2020 | 2011 | 04-Nov-2020 | 1,096 | $1,596 | Renovated/updated. |
| 2502 1255 SEYMOUR STREET | $1,080,000 | $921,000 | 17.26 | $968,000 | 19-Jul-2016 | 2008 | 04-Nov-2020 | 906 | $1,192 | |
| 402 789 W 16TH AVENUE | $522,500 | $559,000 | -6.53 | $618,000 | 22-Sep-2020 | 1995 | 04-Nov-2020 | 648 | $806 | |
| 501 4083 CAMBIE STREET | $579,000 | $600,000 | -3.50 | $499,000 | 17-Sep-2020 | 2017 | 04-Nov-2020 | 637 | $908 | |
| 210 2416 W 3RD AVENUE | $550,000 | $532,700 | 3.25 | $585,000 | 08-Sep-2020 | 1977 | 05-Nov-2020 | 645 | $852 | Renovated/updated. |
| 505 1128 W HASTINGS STREET | $260,000 | $292,100 | -10.99 | $158,000 | 19-Mar-2013 | 1999 | 05-Nov-2020 | 277 | $938 | |
| 211 3788 W 8TH AVENUE | $918,000 | $909,000 | 0.99 | $959,000 | 16-Jul-2020 | 1989 | 05-Nov-2020 | 1,062 | $864 | Renovated/updated. |
| 303 1050 BROUGHTON STREET | $500,000 | $481,500 | 3.84 | $578,000 | 04-Aug-2020 | 1983 | 05-Nov-2020 | 637 | $784 | Renovated/updated. |
| 204 334 E 5TH AVENUE | $356,000 | $267,900 | 32.89 | $329,900 | 26-Oct-2020 | 1977 | 05-Nov-2020 | 424 | $839 | |
| 700 1685 W 14TH AVENUE | $1,700,000 | $1,437,000 | 18.30 | $1,798,000 | 31-Aug-2020 | 1970 | 05-Nov-2020 | 1,811 | $938 | Renovated/updated. |
| 412 360 E 36TH AVENUE | $899,000 | $763,000 | 17.82 | $899,000 | 30-Oct-2020 | 1994 | 05-Nov-2020 | 1,087 | $827 | Renovated/updated. |
| 102 2588 ALDER STREET | $800,000 | $653,000 | 22.51 | $775,000 | 26-Oct-2020 | 1996 | 05-Nov-2020 | 784 | $1,020 | Renovated/updated. |
| 203 1696 W 10TH AVENUE | $755,000 | $729,000 | 3.57 | $788,000 | 28-Oct-2020 | 1975 | 06-Nov-2020 | 1,068 | $706 | Renovated/updated. |
| 701 4815 ELDORADO MEWS | $519,000 | $512,000 | 1.37 | $519,000 | 02-Nov-2020 | 2013 | 06-Nov-2020 | 577 | $899 | |
| 707 950 DRAKE STREET | $490,000 | $527,000 | -7.02 | $509,000 | 26-Oct-2020 | 1982 | 06-Nov-2020 | 551 | $889 | |
| 307 334 E 5TH AVENUE | $457,500 | $429,300 | 6.57 | $485,000 | 29-May-2020 | 1977 | 07-Nov-2020 | 644 | $710 | Renovated/updated. |
| 204 1875 W 8TH AVENUE | $680,000 | $578,500 | 17.55 | $699,000 | 16-Sep-2019 | 1981 | 07-Nov-2020 | 760 | $894 | Renovated/updated. |
| 214 4963 CAMBIE STREET | $850,000 | $820,000 | 3.66 | $929,000 | 29-Sep-2020 | 2019 | 07-Nov-2020 | 872 | $974 | |
| 205 1859 SPYGLASS PLACE | $1,260,000 | $1,098,000 | 14.75 | $1,250,000 | 02-Nov-2020 | 1988 | 08-Nov-2020 | 1,120 | $1,125 | |
| 211 8450 JELLICOE STREET | $455,000 | $412,000 | 10.44 | $568,000 | 22-May-2018 | 1994 | 08-Nov-2020 | 696 | $653 | Renovated/updated. |
| 403 2755 MAPLE STREET | $843,800 | $776,000 | 8.74 | $848,800 | 02-Nov-2020 | 1996 | 08-Nov-2020 | 873 | $966 | |
| 1507 HORNBY STREET | $815,000 | $737,000 | 10.58 | $799,000 | 03-Nov-2020 | 1997 | 09-Nov-2020 | 775 | $1,051 | |
| 1806 888 HOMER STREET | $775,000 | $753,000 | 2.92 | $788,000 | 19-Oct-2020 | 2011 | 09-Nov-2020 | 704 | $1,100 | |
| 1205 1201 MARINASIDE CRESCENT | $1,610,000 | $1,470,000 | 9.52 | $1,658,000 | 06-Oct-2020 | 1996 | 09-Nov-2020 | 1,267 | $1,270 | |
| 402 2119 YEW STREET | $928,000 | $891,000 | 4.15 | $998,000 | 13-Oct-2020 | 1999 | 10-Nov-2020 | 859 | $1,080 | |
| 212 1710 W 13TH AVENUE | $485,000 | $462,900 | 4.77 | $464,900 | 05-Nov-2020 | 1972 | 11-Nov-2020 | 727 | $667 | Renovated/updated. |
| 3004 488 SW MARINE DRIVE | $567,500 | $532,000 | 6.67 | $608,000 | 29-Jul-2020 | 2015 | 12-Nov-2020 | 483 | $1,174 |
41 out of 133 unrenovated resale homes sold below assessed with a median sold price of 4.06
Richmond
| Address | Sold Price | Assessed | % Δ | True List Price | True List Date | Year Built | Sold Date | Sqft | Price per sqft | Notes |
|---|---|---|---|---|---|---|---|---|---|---|
| 611 9388 TOMICKI AVENUE | $526,000 | $486,000 | 8.23 | $548,000 | 07-Jul-2020 | 2016 | 18-Oct-2020 | 630 | $834 | |
| 713 5933 COONEY ROAD | $488,000 | $455,600 | 7.11 | $419,800 | 09-Aug-2016 | 2003 | 18-Oct-2020 | 690 | $707 | |
| 1008 7117 ELMBRIDGE WAY | $640,000 | $631,000 | 1.43 | ? | 04-Feb-2011 | 2012 | 19-Oct-2020 | 831 | $770 | |
| 304 8580 GENERAL CURRIE ROAD | $442,000 | $468,000 | -5.56 | $496,900 | 24-Jul-2020 | 1991 | 19-Oct-2020 | 1,053 | $419 | Renovated/updated. |
| 131 5880 DOVER CRESCENT | $417,000 | $419,000 | -0.48 | $399,000 | 07-Oct-2020 | 1995 | 19-Oct-2020 | 674 | $618 | |
| 1202 9188 HEMLOCK DRIVE | $495,000 | $467,000 | 6.00 | $495,000 | 13-Oct-2020 | 2006 | 19-Oct-2020 | 638 | $775 | |
| 409 9399 TOMICKI AVENUE | $557,000 | $586,000 | -4.95 | $568,000 | 15-Sep-2020 | 2011 | 19-Oct-2020 | 835 | $667 | |
| 122 9399 TOMICKI AVENUE | $602,500 | $614,000 | -1.87 | $615,900 | 16-Oct-2020 | 2011 | 20-Oct-2020 | 947 | $636 | Renovated/updated. |
| 307 6233 LONDON ROAD | $605,000 | $580,000 | 4.31 | $628,000 | 05-Oct-2020 | 2007 | 20-Oct-2020 | 872 | $693 | |
| 225 7531 MINORU BOULEVARD | $370,000 | $317,400 | 16.57 | $349,000 | 14-Oct-2020 | 1983 | 20-Oct-2020 | 673 | $549 | Renovated/updated. |
| 903 3331 BROWN ROAD | $818,000 | $767,000 | 6.65 | $848,000 | 29-Sep-2020 | 2017 | 20-Oct-2020 | 943 | $867 | |
| 327 7751 MINORU BOULEVARD | $385,000 | $344,600 | 11.72 | $398,000 | 09-Oct-2020 | 1983 | 20-Oct-2020 | 677 | $568 | Renovated/updated. |
| 519 9399 ALEXANDRA ROAD | $586,000 | $596,000 | -1.68 | $788,800 | 03-Apr-2018 | 2015 | 20-Oct-2020 | 821 | $713 | |
| 419 9333 TOMICKI AVENUE | $725,000 | $747,100 | -2.96 | $888,000 | 11-Sep-2018 | 2014 | 20-Oct-2020 | 1,069 | $678 | |
| 330 8451 WESTMINSTER HIGHWAY | $371,000 | $274,700 | 35.06 | $365,800 | 15-Sep-2020 | 1982 | 20-Oct-2020 | 656 | $565 | Renovated/updated. |
| 423 9500 ODLIN ROAD | $588,000 | $584,000 | 0.68 | $578,000 | 20-Oct-2020 | 2011 | 21-Oct-2020 | 819 | $717 | |
| 316 10033 RIVER DRIVE | $495,000 | $473,000 | 4.65 | $559,000 | 29-Jan-2019 | 2014 | 21-Oct-2020 | 761 | $650 | |
| 305 8677 CAPSTAN WAY | $550,000 | $561,000 | -1.96 | $738,000 | 18-Sep-2018 | 2016 | 21-Oct-2020 | 703 | $782 | |
| 327 8700 ACKROYD ROAD | $315,000 | $296,000 | 6.42 | $327,000 | 05-Oct-2020 | 1981 | 21-Oct-2020 | 717 | $439 | |
| 1209 6888 ALDERBRIDGE WAY | $480,000 | $483,100 | -0.64 | $489,999 | 20-Oct-2020 | 2008 | 22-Oct-2020 | 664 | $722 | Renovated/updated. |
| 107 5860 DOVER CRESCENT | $715,000 | $630,000 | 13.49 | $728,000 | 20-Oct-2020 | 1997 | 22-Oct-2020 | 1,229 | $581 | |
| 1006 6080 MINORU BOULEVARD | $465,000 | $456,000 | 1.97 | $489,000 | 16-Oct-2020 | 1997 | 23-Oct-2020 | 652 | $713 | |
| 605 7488 LANSDOWNE ROAD | $738,000 | $676,000 | 9.17 | $799,000 | 14-Sep-2020 | 2017 | 23-Oct-2020 | 837 | $881 | |
| 117 8580 GENERAL CURRIE ROAD | $612,000 | $588,000 | 4.08 | $639,000 | 02-Oct-2020 | 1991 | 24-Oct-2020 | 1,382 | $442 | |
| 211 5888 DOVER CRESCENT | $650,000 | $609,000 | 6.73 | $848,000 | 10-Apr-2018 | 1997 | 24-Oct-2020 | 1,200 | $541 | |
| 218 8640 CITATION DRIVE | $390,000 | $403,200 | -3.27 | $429,800 | 31-Aug-2020 | 1980 | 24-Oct-2020 | 890 | $438 | |
| 403 6119 COONEY ROAD | $536,000 | $552,000 | -2.90 | $649,800 | 04-Sep-2019 | 1996 | 24-Oct-2020 | 954 | $561 | |
| 211 11240 MELLIS DRIVE | $455,000 | $434,000 | 4.84 | $468,800 | 15-Sep-2020 | 1986 | 24-Oct-2020 | 1,303 | $349 | Renovated/updated. |
| 6023 5511 HOLLYBRIDGE WAY | $700,800 | $717,000 | -2.26 | $798,800 | 16-Jun-2020 | 2014 | 25-Oct-2020 | 1,032 | $679 | |
| 1805 7488 LANSDOWNE ROAD | $1,390,000 | $1,299,000 | 7.01 | $1,428,000 | 23-Oct-2020 | 2017 | 25-Oct-2020 | 1,348 | $1,031 | |
| 1013 7788 ACKROYD ROAD | $682,000 | $805,000 | -15.28 | $738,000 | 10-Aug-2020 | 2015 | 25-Oct-2020 | 820 | $831 | |
| 607 6951 ELMBRIDGE WAY | $630,000 | $584,000 | 7.88 | $649,000 | 08-Oct-2020 | 2014 | 25-Oct-2020 | 805 | $782 | |
| 1502 6971 ELMBRIDGE WAY | $680,000 | $670,000 | 1.49 | $729,000 | 08-Oct-2020 | 2014 | 25-Oct-2020 | 805 | $844 | |
| 1609 6188 NO 3 ROAD | $752,000 | $747,000 | 0.67 | $839,000 | 10-Sep-2020 | 2016 | 25-Oct-2020 | 865 | $869 | Renovated/updated. |
| 8 6233 KATSURA STREET | $765,000 | $743,000 | 2.96 | $998,000 | 04-Aug-2017 | 2004 | 26-Oct-2020 | 1,467 | $521 | |
| 613 7338 GOLLNER AVENUE | $785,000 | $696,000 | 12.79 | $749,900 | 12-Oct-2020 | 2015 | 26-Oct-2020 | 873 | $899 | |
| 404 14300 RIVERPORT WAY | $720,000 | $764,000 | -5.76 | $0 | 18-Jun-2015 | 2006 | 26-Oct-2020 | 1,313 | $548 | Renovated/updated. |
| 213 8720 NO. 1 ROAD | $400,000 | $378,700 | 5.62 | $389,000 | 06-May-2020 | 1973 | 26-Oct-2020 | 950 | $421 | Renovated/updated. |
| 103 8291 PARK ROAD | $333,800 | $282,700 | 18.08 | $359,000 | 31-Aug-2020 | 1978 | 27-Oct-2020 | 750 | $445 | Renovated/updated. |
| 904 8297 SABA ROAD | $438,000 | $401,000 | 9.23 | $388,000 | 19-Oct-2020 | 1996 | 27-Oct-2020 | 636 | $688 | |
| 227 9388 MCKIM WAY | $576,000 | $530,000 | 8.68 | $595,000 | 01-Sep-2020 | 2012 | 27-Oct-2020 | 839 | $686 | |
| 101 6611 ECKERSLEY ROAD | $437,000 | $373,000 | 17.16 | $439,900 | 20-Oct-2020 | 2009 | 27-Oct-2020 | 585 | $747 | |
| 609 6233 KATSURA STREET | $495,000 | $467,800 | 5.81 | $528,000 | 28-Aug-2020 | 2004 | 27-Oct-2020 | 678 | $730 | |
| 302 9171 FERNDALE ROAD | $582,000 | $613,000 | -5.06 | $680,000 | 23-Jul-2018 | 2008 | 27-Oct-2020 | 980 | $593 | |
| 409 14200 RIVERPORT WAY | $630,000 | $554,000 | 13.72 | $640,000 | 22-Oct-2020 | 2006 | 27-Oct-2020 | 996 | $632 | |
| 205 8880 JONES ROAD | $480,000 | $496,000 | -3.23 | $353,000 | 22-Mar-2012 | 1993 | 28-Oct-2020 | 934 | $513 | Renovated/updated. |
| 213 5311 CEDARBRIDGE WAY | $625,000 | $632,000 | -1.11 | $649,900 | 09-Sep-2020 | 2016 | 28-Oct-2020 | 915 | $683 | |
| 762 6288 NO. 3 ROAD | $488,000 | $445,000 | 9.66 | $558,000 | 09-Sep-2020 | 2016 | 28-Oct-2020 | 505 | $966 | |
| 201 8600 JONES ROAD | $370,000 | $412,000 | -10.19 | $389,000 | 04-Sep-2020 | 1992 | 28-Oct-2020 | 877 | $421 | Renovated/updated. |
| 709 6088 MINORU BOULEVARD | $730,000 | $738,000 | -1.08 | $788,800 | 24-Sep-2020 | 1997 | 29-Oct-2020 | 1,067 | $684 | Renovated/updated. |
| 207 9388 TOMICKI AVENUE | $619,000 | $564,000 | 9.75 | $638,000 | 05-Oct-2020 | 2016 | 29-Oct-2020 | 822 | $753 | Renovated/updated. |
| 117 8600 GENERAL CURRIE ROAD | $458,000 | $427,000 | 7.26 | $525,000 | 25-Mar-2020 | 1990 | 29-Oct-2020 | 1,021 | $448 | |
| 413 12339 STEVESTON HIGHWAY | $385,000 | $342,400 | 12.44 | $420,000 | 10-Aug-2020 | 2014 | 30-Oct-2020 | 493 | $780 | |
| 1111 7488 LANSDOWNE ROAD | $528,000 | $508,000 | 3.94 | $545,000 | 13-Oct-2020 | 2017 | 30-Oct-2020 | 577 | $915 | |
| 109 10631 NO. 3 ROAD | $362,000 | $348,700 | 3.81 | $385,000 | 11-Mar-2020 | 1974 | 30-Oct-2020 | 1,305 | $277 | Renovated/updated. |
| 1601 7080 NO. 3 ROAD | $570,000 | $555,000 | 2.70 | $599,000 | 31-Aug-2020 | 2009 | 31-Oct-2020 | 798 | $714 | |
| 501 7575 ALDERBRIDGE WAY | $576,000 | $589,000 | -2.21 | $569,000 | 28-Oct-2020 | 2007 | 31-Oct-2020 | 868 | $663 | |
| 1511 5233 GILBERT ROAD | $792,000 | $747,000 | 6.02 | $830,000 | 03-Sep-2020 | 2016 | 01-Nov-2020 | 874 | $906 | |
| 115 3051 AIREY DRIVE | $450,000 | $336,000 | 33.93 | $526,800 | 31-Aug-2020 | 1994 | 01-Nov-2020 | 843 | $533 | Renovated/updated. |
| 434 6828 ECKERSLEY ROAD | $620,000 | $591,000 | 4.91 | $649,000 | 02-Mar-2020 | 2011 | 01-Nov-2020 | 907 | $683 | |
| 120 5800 ANDREWS ROAD | $550,000 | $564,000 | -2.48 | $599,888 | 09-Jun-2020 | 1997 | 02-Nov-2020 | 1,072 | $513 | |
| 1202 5088 KWANTLEN STREET | $530,000 | $534,000 | -0.75 | $588,000 | 24-Jul-2020 | 2007 | 03-Nov-2020 | 697 | $760 | |
| 1003 7575 ALDERBRIDGE WAY | $595,000 | $606,000 | -1.82 | $599,000 | 07-Sep-2020 | 2007 | 03-Nov-2020 | 865 | $687 | |
| 219 8411 ACKROYD ROAD | $410,000 | $374,100 | 9.60 | $449,000 | 03-Sep-2020 | 1982 | 04-Nov-2020 | 883 | $464 | Renovated/updated. |
| 511 6651 MINORU BOULEVARD | $425,000 | $473,000 | -10.15 | $425,000 | 08-Sep-2020 | 1973 | 04-Nov-2020 | 1,184 | $358 | |
| 908 6080 MINORU BOULEVARD | $508,000 | $512,000 | -0.78 | $575,000 | 18-Sep-2020 | 1997 | 05-Nov-2020 | 763 | $665 | Renovated/updated. |
| 316 6655 LYNAS LANE | $320,000 | $305,200 | 4.85 | $329,900 | 06-Oct-2020 | 1981 | 05-Nov-2020 | 736 | $434 | Renovated/updated. |
| 1503 7575 ALDERBRIDGE WAY | $888,000 | $883,000 | 0.57 | $968,000 | 14-Jun-2018 | 2007 | 06-Nov-2020 | 1,341 | $662 | |
| 808 8333 ANDERSON ROAD | $445,000 | $410,000 | 8.54 | $469,000 | 07-Oct-2020 | 2011 | 07-Nov-2020 | 568 | $783 | |
| 209 9388 TOMICKI AVENUE | $562,120 | $526,000 | 6.87 | $688,000 | 27-Aug-2018 | 2016 | 07-Nov-2020 | 755 | $744 | |
| 1211 9171 FERNDALE ROAD | $475,000 | $463,000 | 2.59 | $528,800 | 14-Sep-2020 | 2008 | 09-Nov-2020 | 630 | $753 |
16 out of 51 unrenovated resale homes sold below assessed with a median sold price of 4.08
Burnaby
| Address | Sold Price | Assessed | % Δ | True List Price | True List Date | Year Built | Sold Date | Sqft | Price per sqft | Notes |
|---|---|---|---|---|---|---|---|---|---|---|
| 601 5899 WILSON AVENUE | $685,000 | $620,000 | 10.48 | $718,000 | 13-Aug-2020 | 1995 | 18-Oct-2020 | 1,199 | $571 | Renovated/updated. |
| 301 7418 BYRNEPARK WALK | $475,000 | $453,000 | 4.86 | $497,000 | 20-Jul-2020 | 2010 | 18-Oct-2020 | 618 | $768 | |
| 3105 2388 MADISON AVENUE | $696,000 | $769,000 | -9.49 | $749,900 | 13-Mar-2020 | 2019 | 18-Oct-2020 | 761 | $914 | Brand New. |
| 2210 7303 NOBLE LANE | $753,300 | $741,000 | 1.66 | $799,900 | 08-Sep-2020 | 2019 | 19-Oct-2020 | 855 | $881 | Renovated/updated. |
| 103 9890 MANCHESTER DRIVE | $420,000 | $418,100 | 0.45 | $440,000 | 03-Sep-2020 | 1981 | 19-Oct-2020 | 910 | $461 | Renovated/updated. |
| 1601 7178 COLLIER STREET | $468,000 | $466,000 | 0.43 | $485,000 | 28-Aug-2020 | 2005 | 19-Oct-2020 | 635 | $737 | |
| 109 2088 BETA AVENUE | $652,500 | $620,000 | 5.24 | $688,000 | 03-Sep-2020 | 2009 | 19-Oct-2020 | 928 | $703 | |
| 316 7131 STRIDE AVENUE | $498,000 | $492,000 | 1.22 | $499,900 | 05-Oct-2020 | 2013 | 19-Oct-2020 | 673 | $739 | Renovated/updated. |
| 209 9233 GOVERNMENT STREET | $542,500 | $532,000 | 1.97 | $569,900 | 28-Sep-2020 | 2007 | 19-Oct-2020 | 895 | $606 | |
| 204 5674 JERSEY AVENUE | $499,500 | $490,000 | 1.94 | $529,900 | 27-Jul-2020 | 1989 | 19-Oct-2020 | 968 | $516 | Renovated/updated. |
| 2101 9888 CAMERON STREET | $483,000 | $488,000 | -1.02 | $499,900 | 30-Sep-2020 | 2008 | 19-Oct-2020 | 630 | $766 | |
| 3001 4485 SKYLINE DRIVE | $840,000 | $828,000 | 1.45 | $928,000 | 16-Sep-2020 | 2017 | 19-Oct-2020 | 931 | $902 | |
| 1302 6461 TELFORD AVENUE | $748,000 | $748,000 | 0.00 | $765,000 | 22-Jun-2020 | 2011 | 19-Oct-2020 | 890 | $840 | |
| 301 6860 RUMBLE STREET | $395,000 | $357,600 | 10.46 | $435,000 | 28-Aug-2020 | 1992 | 20-Oct-2020 | 712 | $554 | |
| 311 3883 LAUREL STREET | $310,000 | $267,200 | 16.02 | ? | 01-Feb-2012 | 1983 | 20-Oct-2020 | 680 | $455 | |
| 205 9603 MANCHESTER DRIVE | $610,000 | $596,000 | 2.35 | ? | 18-Jul-2012 | 1993 | 20-Oct-2020 | 1,142 | $534 | Renovated/updated. |
| 201 6168 WILSON AVENUE | $850,000 | $858,000 | -0.93 | $899,999 | 16-Sep-2020 | 2012 | 20-Oct-2020 | 1,155 | $735 | |
| 1001 4880 BENNETT STREET | $690,000 | $600,000 | 15.00 | $790,000 | 30-Jul-2019 | 2013 | 20-Oct-2020 | 812 | $849 | |
| 326 6283 KINGSWAY | $539,800 | $538,000 | 0.33 | $588,000 | 16-Mar-2020 | 2018 | 20-Oct-2020 | 736 | $733 | |
| 2809 4485 SKYLINE DRIVE | $880,000 | $807,000 | 9.05 | $919,000 | 09-Sep-2020 | 2017 | 20-Oct-2020 | 920 | $956 | |
| 1505 1788 GILMORE AVENUE | $814,020 | $749,000 | 8.68 | $890,000 | 29-Jul-2020 | 2019 | 20-Oct-2020 | 942 | $864 | |
| 2502 2225 HOLDOM AVENUE | $583,500 | $581,000 | 0.43 | $599,900 | 13-Oct-2020 | 2007 | 21-Oct-2020 | 867 | $673 | |
| 1205 4888 BRENTWOOD DRIVE | $505,000 | $484,000 | 4.34 | $519,900 | 16-Oct-2020 | 2008 | 21-Oct-2020 | 699 | $722 | |
| 401 3971 HASTINGS STREET | $899,900 | $856,000 | 5.13 | $899,900 | 12-Mar-2020 | 2019 | 21-Oct-2020 | 1,008 | $892 | |
| 501 5645 BARKER AVENUE | $366,000 | $321,500 | 13.84 | ? | 10-May-2013 | 1974 | 21-Oct-2020 | 675 | $542 | |
| 1007 9060 UNIVERSITY CRESCENT | $550,000 | $640,000 | -14.06 | $599,000 | 07-Aug-2020 | 2015 | 21-Oct-2020 | 802 | $685 | |
| 212 7465 SANDBORNE AVENUE | $486,000 | $513,000 | -5.26 | ? | 01-May-2012 | 1990 | 21-Oct-2020 | 920 | $528 | |
| 2209 6658 DOW AVENUE | $799,888 | $778,000 | 2.81 | $828,000 | 29-Sep-2020 | 2013 | 21-Oct-2020 | 895 | $893 | |
| 2910 6538 NELSON AVENUE | $775,000 | $753,000 | 2.92 | $798,000 | 19-Oct-2020 | 2017 | 21-Oct-2020 | 756 | $1,025 | |
| 21B 6128 PATTERSON AVENUE | $643,000 | $609,000 | 5.58 | $848,000 | 18-Jul-2018 | 1992 | 22-Oct-2020 | 1,028 | $625 | |
| 107 7180 LINDEN AVENUE | $295,000 | $283,400 | 4.09 | $299,800 | 01-Oct-2020 | 1973 | 22-Oct-2020 | 733 | $402 | Renovated/updated. |
| 27 7179 18TH AVENUE | $590,000 | $569,000 | 3.69 | $599,900 | 14-Oct-2020 | 1997 | 22-Oct-2020 | 1,024 | $576 | |
| 309 7777 ROYAL OAK AVENUE | $463,500 | $443,000 | 4.63 | $509,000 | 01-May-2018 | 2012 | 22-Oct-2020 | 626 | $740 | |
| 203 9151 SATURNA DRIVE | $399,000 | $368,000 | 8.42 | $399,000 | 30-Sep-2020 | 1976 | 22-Oct-2020 | 830 | $480 | Renovated/updated. |
| 2206 2388 MADISON AVENUE | $740,000 | $795,000 | -6.92 | $800,000 | 18-Feb-2020 | 2019 | 22-Oct-2020 | 799 | $926 | Brand New. |
| 1908 6333 SILVER AVENUE | $690,000 | $645,000 | 6.98 | $699,999 | 16-Oct-2020 | 2015 | 23-Oct-2020 | 732 | $942 | |
| 405 6820 RUMBLE STREET | $490,000 | $477,000 | 2.73 | $569,000 | 19-Nov-2019 | 1992 | 23-Oct-2020 | 934 | $524 | Renovated/updated. |
| 206 3770 THURSTON STREET | $540,000 | $473,000 | 14.16 | ? | 15-Oct-2014 | 1994 | 23-Oct-2020 | 1,040 | $519 | |
| 1809 4670 ASSEMBLY WAY | $625,000 | $546,000 | 14.47 | $599,999 | 15-Oct-2020 | 2018 | 23-Oct-2020 | 604 | $1,034 | |
| 315 6707 SOUTHPOINT DRIVE | $635,000 | $600,000 | 5.83 | $649,000 | 13-Oct-2020 | 1989 | 23-Oct-2020 | 1,190 | $533 | Renovated/updated. |
| 508 2188 MADISON AVENUE | $728,000 | $654,000 | 11.31 | $738,000 | 30-Sep-2020 | 2018 | 23-Oct-2020 | 878 | $829 | |
| 707 4160 ALBERT STREET | $780,000 | $693,000 | 12.55 | $799,900 | 14-Sep-2020 | 1992 | 24-Oct-2020 | 1,028 | $758 | Renovated/updated. |
| 404 6622 SOUTHOAKS CRESCENT | $602,000 | $560,000 | 7.50 | $599,000 | 09-Oct-2020 | 1997 | 25-Oct-2020 | 1,038 | $579 | |
| 109 4783 DAWSON STREET | $645,000 | $602,000 | 7.14 | $658,000 | 13-Oct-2020 | 2007 | 25-Oct-2020 | 900 | $716 | |
| 908 4900 LENNOX LANE | $719,000 | $668,000 | 7.63 | $765,000 | 01-Apr-2019 | 2017 | 25-Oct-2020 | 755 | $952 | |
| 1108 3760 ALBERT STREET | $567,500 | $522,000 | 8.72 | $579,000 | 21-Oct-2020 | 1983 | 25-Oct-2020 | 954 | $594 | Renovated/updated. |
| 1502 9595 ERICKSON DRIVE | $365,000 | $352,000 | 3.69 | $379,000 | 13-Jul-2020 | 1981 | 25-Oct-2020 | 743 | $491 | Renovated/updated. |
| 3210 9888 CAMERON STREET | $635,000 | $711,000 | -10.69 | $689,000 | 04-Aug-2020 | 2008 | 25-Oct-2020 | 961 | $660 | |
| 401 7908 15TH AVENUE | $610,000 | $538,000 | 13.38 | $698,000 | 05-Oct-2020 | 2018 | 26-Oct-2020 | 835 | $730 | Renovated/updated. |
| 1008 6538 NELSON AVENUE | $532,000 | $487,000 | 9.24 | $419,000 | 10-Feb-2017 | 2017 | 26-Oct-2020 | 508 | $1,047 | |
| 411 9890 MANCHESTER DRIVE | $378,000 | $404,400 | -6.53 | $375,000 | 20-Oct-2020 | 1981 | 26-Oct-2020 | 890 | $424 | Renovated/updated. |
| 111 3388 MORREY COURT | $459,800 | $421,000 | 9.22 | $459,800 | 19-Oct-2020 | 2005 | 26-Oct-2020 | 728 | $631 | Renovated/updated. |
| 2706 2008 ROSSER AVENUE | $590,000 | $570,000 | 3.51 | $650,000 | 26-Feb-2019 | 2015 | 26-Oct-2020 | 593 | $994 | |
| 29 5988 HASTINGS STREET | $410,000 | $412,500 | -0.61 | $419,900 | 02-Oct-2020 | 1993 | 26-Oct-2020 | 694 | $590 | |
| 1103 2378 ALPHA AVENUE | $716,000 | $733,000 | -2.32 | $749,000 | 17-Aug-2020 | 2018 | 26-Oct-2020 | 766 | $934 | |
| 400 6707 SOUTHPOINT DRIVE | $565,000 | $553,000 | 2.17 | $599,999 | 25-Aug-2020 | 1989 | 26-Oct-2020 | 1,041 | $542 | Renovated/updated. |
| 1906 3980 CARRIGAN COURT | $538,888 | $499,000 | 7.99 | $550,000 | 09-Oct-2020 | 1985 | 26-Oct-2020 | 929 | $580 | Renovated/updated. |
| 3902 6333 SILVER AVENUE | $716,000 | $714,000 | 0.28 | $729,000 | 07-Oct-2020 | 2015 | 27-Oct-2020 | 747 | $958 | |
| 107 3883 LAUREL STREET | $285,000 | $282,300 | 0.96 | $299,900 | 22-Nov-2019 | 1983 | 27-Oct-2020 | 715 | $398 | |
| 1601 7328 ARCOLA STREET | $767,000 | $768,000 | -0.13 | $775,000 | 17-Sep-2020 | 2009 | 27-Oct-2020 | 1,132 | $677 | Renovated/updated. |
| 1106 4398 BUCHANAN STREET | $585,000 | $538,000 | 8.74 | $628,000 | 10-Dec-2019 | 2000 | 27-Oct-2020 | 830 | $704 | |
| 2106 6333 SILVER AVENUE | $545,000 | $512,000 | 6.45 | ? | 31-Oct-2014 | 2015 | 28-Oct-2020 | 513 | $1,062 | |
| 2703 2289 YUKON CRESCENT | $645,000 | $629,000 | 2.54 | $679,800 | 11-Aug-2020 | 2008 | 28-Oct-2020 | 821 | $785 | |
| 102 9233 GOVERNMENT STREET | $513,000 | $511,000 | 0.39 | $539,900 | 25-Sep-2020 | 2007 | 28-Oct-2020 | 866 | $592 | |
| 402 6888 SOUTHPOINT DRIVE | $617,500 | $581,000 | 6.28 | $668,000 | 28-Jul-2020 | 2006 | 29-Oct-2020 | 925 | $667 | |
| 305 4380 HALIFAX STREET | $692,500 | $611,000 | 13.34 | $788,000 | 28-Sep-2020 | 2004 | 29-Oct-2020 | 1,021 | $678 | |
| 207 5281 OAKMOUNT CRESCENT | $467,000 | $373,600 | 25.00 | $449,900 | 15-Oct-2020 | 1996 | 29-Oct-2020 | 641 | $728 | Renovated/updated. |
| 404 9880 MANCHESTER DRIVE | $370,000 | $408,200 | -9.36 | ? | 11-Aug-2014 | 1981 | 30-Oct-2020 | 903 | $409 | |
| 1602 4425 HALIFAX STREET | $808,000 | $764,000 | 5.76 | $825,000 | 30-Sep-2020 | 1998 | 30-Oct-2020 | 1,135 | $711 | |
| 809 7303 NOBLE LANE | $523,800 | $454,000 | 15.37 | $538,000 | 14-Oct-2020 | 2019 | 30-Oct-2020 | 544 | $962 | |
| 1107 9060 UNIVERSITY CRESCENT | $586,000 | $645,000 | -9.15 | $690,000 | 10-Aug-2020 | 2015 | 30-Oct-2020 | 802 | $730 | |
| 408 5262 OAKMOUNT CRESCENT | $784,000 | $739,000 | 6.09 | $809,000 | 23-Nov-2019 | 1994 | 31-Oct-2020 | 1,200 | $653 | Renovated/updated. |
| 605 4134 MAYWOOD STREET | $483,000 | $446,000 | 8.30 | $483,000 | 25-Oct-2020 | 1985 | 31-Oct-2020 | 915 | $527 | |
| 118 3770 MANOR STREET | $417,000 | $385,400 | 8.20 | $428,000 | 14-Oct-2020 | 1991 | 01-Nov-2020 | 684 | $609 | Renovated/updated. |
| 204 4105 IMPERIAL STREET | $442,000 | $430,000 | 2.79 | $449,000 | 22-Oct-2020 | 1976 | 01-Nov-2020 | 896 | $493 | Renovated/updated. |
| 417 7058 14TH AVENUE | $450,100 | $371,000 | 21.32 | $449,000 | 19-Oct-2020 | 2015 | 01-Nov-2020 | 532 | $846 | |
| 805 6461 TELFORD AVENUE | $715,000 | $690,000 | 3.62 | $792,000 | 13-Mar-2019 | 2011 | 02-Nov-2020 | 865 | $826 | |
| 1203 7275 SALISBURY AVENUE | $437,000 | $437,800 | -0.18 | $468,000 | 05-Aug-2020 | 1981 | 02-Nov-2020 | 780 | $560 | Renovated/updated. |
| 1806 4118 DAWSON STREET | $632,500 | $670,000 | -5.60 | $799,000 | 21-Aug-2020 | 2006 | 03-Nov-2020 | 880 | $718 | |
| 1402 6240 MCKAY AVENUE | $699,000 | $576,000 | 21.35 | $699,000 | 30-Oct-2020 | 1989 | 03-Nov-2020 | 1,173 | $595 | Renovated/updated. |
| 214 5340 HASTINGS STREET | $325,000 | $332,000 | -2.11 | $350,000 | 26-Aug-2020 | 1975 | 03-Nov-2020 | 677 | $480 | |
| 202 9150 SATURNA DRIVE | $479,500 | $473,000 | 1.37 | $499,900 | 01-Oct-2020 | 1976 | 04-Nov-2020 | 1,172 | $409 | Renovated/updated. |
| 422 6707 SOUTHPOINT DRIVE | $422,000 | $412,800 | 2.23 | $429,900 | 12-Oct-2020 | 1989 | 04-Nov-2020 | 771 | $547 | Renovated/updated. |
| 2903 9888 CAMERON STREET | $490,000 | $513,000 | -4.48 | $499,000 | 21-Oct-2020 | 2008 | 05-Nov-2020 | 684 | $716 |
12 out of 51 unrenovated resale homes sold below assessed with a median sold price of 3.69
West Vancouver
| Address | Sold Price | Assessed | % Δ | True List Price | True List Date | Year Built | Sold Date | Sqft | Price per sqft | Notes |
|---|---|---|---|---|---|---|---|---|---|---|
| 402 3355 CYPRESS PLACE | $1,499,000 | $1,405,000 | 6.69 | $1,499,000 | 08-Oct-2020 | 2004 | 18-Oct-2020 | 1,571 | $954 | |
| 503 2135 ARGYLE AVENUE | $700,000 | $734,600 | -4.71 | $759,000 | 02-Sep-2020 | 1961 | 20-Oct-2020 | 813 | $861 | |
| 4 2130 MARINE DRIVE | $620,000 | $603,000 | 2.82 | $649,000 | 14-Sep-2020 | 1988 | 21-Oct-2020 | 891 | $695 | Renovated/updated. |
| 600 888 ARTHUR ERICKSON PLACE | $1,080,000 | $1,236,000 | -12.62 | $1,366,000 | 22-May-2019 | 2015 | 22-Oct-2020 | 981 | $1,100 | |
| 414 1363 CLYDE AVENUE | $600,000 | $599,300 | 0.12 | $598,000 | 31-Jan-2017 | 1980 | 26-Oct-2020 | 1,080 | $555 | |
| 405 150 24TH STREET | $1,640,000 | $1,730,000 | -5.20 | $1,550,000 | 22-Oct-2020 | 1963 | 27-Oct-2020 | 1,304 | $1,257 | |
| 200 1819 BELLEVUE AVENUE | $1,100,000 | $1,758,000 | -37.43 | $1,777,000 | 12-Nov-2019 | 1986 | 01-Nov-2020 | 1,600 | $687 | |
| 803 3355 CYPRESS PLACE | $1,750,000 | $1,898,000 | -7.80 | $1,798,000 | 13-Jul-2020 | 2004 | 04-Nov-2020 | 2,028 | $862 | |
| 107 2274 FOLKESTONE WAY | $1,210,000 | $984,300 | 22.93 | $1,379,000 | 21-May-2019 | 1985 | 04-Nov-2020 | 1,228 | $985 |
5 out of 8 unrenovated resale homes sold below assessed with a median sold price of -4.96
New Westminster
| Address | Sold Price | Assessed | % Δ | True List Price | True List Date | Year Built | Sold Date | Sqft | Price per sqft | Notes |
|---|---|---|---|---|---|---|---|---|---|---|
| 1103 410 CARNARVON STREET | $635,000 | $642,000 | -1.09 | $668,900 | 28-Sep-2020 | 1990 | 18-Oct-2020 | 1,390 | $456 | Renovated/updated. |
| 304 83 STAR CRESCENT | $450,000 | $506,000 | -11.07 | $474,000 | 08-Apr-2019 | 1998 | 18-Oct-2020 | 938 | $479 | Renovated/updated. |
| 414 262 SALTER STREET | $754,000 | $704,000 | 7.10 | $759,000 | 06-Oct-2020 | 2015 | 18-Oct-2020 | 1,387 | $543 | |
| 108 262 SALTER STREET | $609,350 | $498,000 | 22.36 | $615,000 | 15-Oct-2020 | 2015 | 19-Oct-2020 | 926 | $658 | |
| 401 7 RIALTO COURT | $605,000 | $560,000 | 8.04 | $619,900 | 28-Sep-2020 | 2005 | 19-Oct-2020 | 1,008 | $600 | |
| 1207 271 FRANCIS WAY | $493,500 | $464,000 | 6.36 | $488,800 | 12-Oct-2020 | 2016 | 19-Oct-2020 | 643 | $767 | |
| 302 110 SEVENTH STREET | $421,000 | $379,300 | 10.99 | $429,900 | 02-Sep-2020 | 1977 | 20-Oct-2020 | 927 | $454 | Renovated/updated. |
| 1001 98 TENTH STREET | $585,000 | $603,000 | -2.99 | $625,000 | 17-Jun-2020 | 1991 | 21-Oct-2020 | 1,455 | $402 | |
| 501 210 SALTER STREET | $560,000 | $614,000 | -8.79 | $599,000 | 07-Aug-2020 | 2017 | 22-Oct-2020 | 859 | $651 | |
| 404 209 CARNARVON STREET | $388,000 | $405,000 | -4.20 | $368,800 | 13-Oct-2020 | 1976 | 22-Oct-2020 | 908 | $427 | Renovated/updated. |
| 209 18 SMOKEY SMITH PLACE | $540,000 | $463,000 | 16.63 | $545,000 | 19-Oct-2020 | 2000 | 23-Oct-2020 | 877 | $615 | Renovated/updated. |
| 101 26 E ROYAL AVENUE | $750,000 | $709,000 | 5.78 | $849,000 | 30-Jul-2020 | 2018 | 24-Oct-2020 | 1,123 | $667 | |
| 203 98 TENTH STREET | $500,000 | $501,000 | -0.20 | $559,900 | 09-Oct-2020 | 1991 | 24-Oct-2020 | 1,243 | $402 | |
| 205 420 CARNARVON STREET | $570,000 | $566,000 | 0.71 | $569,900 | 19-Oct-2020 | 1990 | 25-Oct-2020 | 1,152 | $494 | Renovated/updated. |
| 303 610 VICTORIA STREET | $482,000 | $408,000 | 18.14 | $517,000 | 23-Sep-2020 | 2007 | 25-Oct-2020 | 630 | $765 | |
| 105 260 SALTER STREET | $592,500 | $541,000 | 9.52 | $608,800 | 18-Sep-2020 | 2015 | 25-Oct-2020 | 950 | $623 | |
| 401 509 CARNARVON STREET | $459,000 | $478,000 | -3.97 | $459,000 | 23-Oct-2020 | 1993 | 25-Oct-2020 | 923 | $497 | Renovated/updated. |
| 405 410 AGNES STREET | $355,000 | $332,200 | 6.86 | $379,000 | 05-Oct-2020 | 1975 | 26-Oct-2020 | 714 | $497 | Renovated/updated. |
| 1403 188 AGNES STREET | $630,000 | $650,000 | -3.08 | $634,900 | 02-Oct-2020 | 2017 | 26-Oct-2020 | 928 | $678 | |
| 205 1040 FOURTH AVENUE | $340,000 | $353,000 | -3.68 | $349,999 | 20-Oct-2020 | 1975 | 26-Oct-2020 | 1,015 | $334 | |
| 217 74 MINER STREET | $415,000 | $379,400 | 9.38 | $438,900 | 14-Sep-2020 | 1988 | 26-Oct-2020 | 975 | $425 | Renovated/updated. |
| 308 737 HAMILTON STREET | $543,000 | $489,900 | 10.84 | $549,900 | 20-Oct-2020 | 1984 | 26-Oct-2020 | 1,125 | $482 | Renovated/updated. |
| 202 1169 EIGHTH AVENUE | $445,000 | $380,800 | 16.86 | $500,000 | 26-Aug-2020 | 1982 | 28-Oct-2020 | 980 | $454 | Renovated/updated. |
| 801 8 LAGUNA COURT | $539,000 | $510,000 | 5.69 | $549,900 | 06-Oct-2020 | 1991 | 28-Oct-2020 | 1,309 | $411 | Renovated/updated. |
| 2002 280 ROSS DRIVE | $620,000 | $564,000 | 9.93 | $649,000 | 02-Oct-2020 | 2010 | 28-Oct-2020 | 1,011 | $613 | |
| 105 625 HAMILTON STREET | $425,000 | $410,800 | 3.46 | $430,000 | 05-Oct-2020 | 1974 | 28-Oct-2020 | 976 | $435 | Renovated/updated. |
| 201 608 BELMONT STREET | $485,000 | $493,000 | -1.62 | $525,000 | 29-Sep-2020 | 2011 | 29-Oct-2020 | 781 | $620 | |
| 205 620 SEVENTH AVENUE | $399,000 | $361,000 | 10.53 | $415,000 | 16-Sep-2020 | 1976 | 29-Oct-2020 | 971 | $410 | Renovated/updated. |
| 404 320 ROYAL AVENUE | $325,000 | $301,200 | 7.90 | $339,900 | 09-Oct-2020 | 1975 | 29-Oct-2020 | 647 | $502 | Renovated/updated. |
| 1601 8 LAGUNA COURT | $622,000 | $568,000 | 9.51 | $699,000 | 13-Mar-2020 | 1991 | 29-Oct-2020 | 1,329 | $468 | |
| 409 315 KNOX STREET | $490,000 | $440,000 | 11.36 | $499,800 | 20-Oct-2020 | 2007 | 29-Oct-2020 | 820 | $597 | Renovated/updated. |
| 211 262 SALTER STREET | $749,000 | $642,000 | 16.67 | $749,000 | 26-Oct-2020 | 2015 | 30-Oct-2020 | 1,176 | $636 | Renovated/updated. |
| 315 808 SANGSTER PLACE | $459,000 | $394,000 | 16.50 | $459,900 | 26-Oct-2020 | 2004 | 30-Oct-2020 | 766 | $599 | Renovated/updated. |
| 503 500 ROYAL AVENUE | $583,500 | $577,000 | 1.13 | $590,000 | 14-Oct-2020 | 2014 | 01-Nov-2020 | 835 | $698 | |
| 309 707 GLOUCESTER STREET | $290,000 | $275,800 | 5.15 | $299,000 | 28-Oct-2020 | 1976 | 01-Nov-2020 | 628 | $461 | Renovated/updated. |
| 211 611 BLACKFORD STREET | $290,000 | $246,800 | 17.50 | $299,900 | 02-Nov-2020 | 1964 | 02-Nov-2020 | 555 | $522 | |
| 505 833 AGNES STREET | $500,000 | $470,000 | 6.38 | $524,800 | 21-Oct-2020 | 2006 | 02-Nov-2020 | 762 | $656 | |
| 904 280 ROSS DRIVE | $630,000 | $547,000 | 15.17 | $688,000 | 08-Sep-2020 | 2010 | 03-Nov-2020 | 1,148 | $548 | |
| 209B 1210 QUAYSIDE DRIVE | $565,000 | $622,000 | -9.16 | $639,000 | 09-Sep-2020 | 1989 | 05-Nov-2020 | 1,573 | $359 | |
| 1605 71 JAMIESON COURT | $740,000 | $706,000 | 4.82 | $464,800 | 08-Sep-2014 | 1992 | 07-Nov-2020 | 1,434 | $516 | Renovated/updated. |
7 out of 20 unrenovated resale homes sold below assessed with a median sold price of 6.37
North Vancouver
| Address | Sold Price | Assessed | % Δ | True List Price | True List Date | Year Built | Sold Date | Sqft | Price per sqft | Notes |
|---|---|---|---|---|---|---|---|---|---|---|
| 503 555 W 28TH STREET | $520,000 | $480,600 | 8.20 | $578,000 | 25-Jan-2019 | 1968 | 18-Oct-2020 | 924 | $562 | Renovated/updated. |
| 311 177 W 3RD STREET | $1,234,900 | $1,039,000 | 18.85 | $1,289,900 | 22-Jul-2020 | 2019 | 18-Oct-2020 | 1,238 | $997 | |
| 2003 2016 FULLERTON AVENUE | $355,000 | $334,600 | 6.10 | $348,000 | 08-Sep-2020 | 1972 | 18-Oct-2020 | 534 | $664 | Renovated/updated. |
| 303 111 E 3RD STREET | $600,000 | $648,000 | -7.41 | $639,000 | 08-Jun-2020 | 2013 | 18-Oct-2020 | 663 | $904 | |
| 1001 125 E 14TH STREET | $592,000 | $580,000 | 2.07 | $635,000 | 08-Jul-2019 | 2017 | 19-Oct-2020 | 575 | $1,029 | |
| 1310 2020 FULLERTON AVENUE | $550,000 | $536,600 | 2.50 | $599,500 | 01-Oct-2020 | 1975 | 19-Oct-2020 | 908 | $605 | Renovated/updated. |
| 2801 680 SEYLYNN CRESCENT | $999,000 | $1,021,000 | -2.15 | $1,128,000 | 07-Sep-2020 | 2018 | 19-Oct-2020 | 1,022 | $977 | Renovated/updated. |
| 102 333 W 4TH STREET | $490,000 | $475,000 | 3.16 | $498,000 | 13-Oct-2020 | 1987 | 19-Oct-2020 | 773 | $633 | |
| 4 369 W 4TH STREET | $398,800 | $388,900 | 2.55 | $398,800 | 13-Oct-2020 | 1972 | 20-Oct-2020 | 750 | $531 | Renovated/updated. |
| 608 719 W 3RD STREET | $824,000 | $810,000 | 1.73 | $835,000 | 30-Sep-2020 | 2017 | 20-Oct-2020 | 882 | $934 | Renovated/updated. |
| 307 935 W 16TH STREET | $605,000 | $634,000 | -4.57 | $679,500 | 23-May-2018 | 2009 | 20-Oct-2020 | 884 | $684 | |
| 110 341 W 3RD STREET | $591,000 | $571,000 | 3.50 | $685,000 | 26-Sep-2018 | 1975 | 21-Oct-2020 | 946 | $624 | Renovated/updated. |
| 1003 680 SEYLYNN CRESCENT | $829,900 | $795,000 | 4.39 | $905,900 | 09-Jan-2019 | 2018 | 21-Oct-2020 | 971 | $854 | |
| 410 168 CHADWICK COURT | $912,500 | $961,000 | -5.05 | $968,000 | 13-Oct-2020 | 1990 | 21-Oct-2020 | 1,057 | $863 | |
| 5 2345 LONSDALE AVENUE | $440,000 | $451,600 | -2.57 | $459,000 | 08-Sep-2020 | 1975 | 22-Oct-2020 | 916 | $480 | Renovated/updated. |
| 201 960 LYNN VALLEY ROAD | $399,000 | $348,000 | 14.66 | $399,000 | 10-Aug-2020 | 2002 | 22-Oct-2020 | 669 | $596 | |
| 206 365 E 1ST STREET | $635,000 | $644,000 | -1.40 | $699,000 | 16-Jun-2020 | 1999 | 22-Oct-2020 | 840 | $755 | |
| 317 221 E 3RD STREET | $890,000 | $889,000 | 0.11 | $1,059,000 | 08-Jan-2020 | 2013 | 22-Oct-2020 | 1,052 | $846 | |
| 521 723 W 3RD STREET | $720,000 | $695,000 | 3.60 | $729,000 | 14-Oct-2020 | 2015 | 22-Oct-2020 | 804 | $895 | Renovated/updated. |
| 209 141 E 18TH STREET | $530,000 | $522,400 | 1.45 | $549,000 | 20-Oct-2020 | 1975 | 22-Oct-2020 | 1,100 | $481 | |
| 1259 PLATEAU DRIVE | $610,000 | $539,200 | 13.13 | $637,000 | 17-Apr-2018 | 1950 | 23-Oct-2020 | 869 | $701 | |
| 1310 118 CARRIE CATES COURT | $1,360,000 | $815,000 | 66.87 | $1,388,000 | 13-Oct-2020 | 2019 | 23-Oct-2020 | 903 | $1,506 | |
| 313 317 BEWICKE AVENUE | $570,000 | $573,000 | -0.52 | $599,000 | 07-Jun-2019 | 2013 | 23-Oct-2020 | 672 | $848 | |
| 214 3220 CONNAUGHT CRESCENT | $1,060,000 | $1,061,000 | -0.09 | $1,368,000 | 12-Jun-2019 | 2019 | 23-Oct-2020 | 897 | $1,181 | |
| 202 118 E 2ND STREET | $740,000 | $666,000 | 11.11 | $788,450 | 24-Aug-2020 | 1993 | 23-Oct-2020 | 1,028 | $719 | |
| 301 212 LONSDALE AVENUE | $591,000 | $646,000 | -8.51 | $619,000 | 13-Oct-2020 | 1998 | 24-Oct-2020 | 776 | $761 | Renovated/updated. |
| 907 2012 FULLERTON AVENUE | $305,000 | $266,500 | 14.45 | $315,000 | 14-Oct-2020 | 1972 | 24-Oct-2020 | 450 | $677 | Renovated/updated. |
| 211 123 W 1ST STREET | $1,050,000 | $1,054,000 | -0.38 | $1,045,000 | 13-Oct-2020 | 2016 | 25-Oct-2020 | 1,065 | $985 | |
| 103 345 LONSDALE AVENUE | $875,000 | $742,000 | 17.92 | $1,150,000 | 03-Feb-2020 | 1999 | 25-Oct-2020 | 1,354 | $646 | Renovated/updated. |
| 510 255 W 1ST STREET | $826,000 | $823,000 | 0.36 | $845,000 | 08-Sep-2020 | 2017 | 25-Oct-2020 | 889 | $929 | |
| 208 719 W 3RD STREET | $640,000 | $608,000 | 5.26 | $679,000 | 10-Jul-2020 | 2017 | 25-Oct-2020 | 741 | $863 | |
| 203 3125 CAPILANO CRESCENT | $915,000 | $949,000 | -3.58 | $948,000 | 20-Oct-2020 | 2003 | 26-Oct-2020 | 1,384 | $661 | |
| 207 277 W 1ST STREET | $925,000 | $939,000 | -1.49 | $975,000 | 04-May-2020 | 2017 | 27-Oct-2020 | 1,016 | $910 | |
| 101 2020 FULLERTON AVENUE | $549,000 | $529,000 | 3.78 | $549,000 | 19-Oct-2020 | 1975 | 27-Oct-2020 | 1,037 | $529 | Renovated/updated. |
| 120 723 W 3RD STREET | $1,085,000 | $1,020,000 | 6.37 | $1,175,000 | 12-Aug-2020 | 2015 | 27-Oct-2020 | 1,332 | $814 | |
| 206 131 E 3RD STREET | $750,000 | $746,000 | 0.54 | $825,000 | 03-Jun-2020 | 2016 | 28-Oct-2020 | 794 | $944 | |
| 324 255 W 1ST STREET | $1,155,000 | $1,149,000 | 0.52 | $1,175,000 | 22-Oct-2020 | 2017 | 28-Oct-2020 | 1,293 | $893 | |
| 408 625 E 3RD STREET | $698,000 | $649,000 | 7.55 | $739,000 | 05-Oct-2020 | 2019 | 28-Oct-2020 | 779 | $896 | |
| 210 1033 ST. GEORGES AVENUE | $440,000 | $426,600 | 3.14 | $449,800 | 26-Oct-2020 | 2011 | 28-Oct-2020 | 635 | $692 | |
| 407 1679 LLOYD AVENUE | $500,000 | $491,000 | 1.83 | $509,900 | 02-Sep-2020 | 2011 | 28-Oct-2020 | 600 | $833 | |
| 305 4390 GALLANT AVENUE | $1,050,000 | $712,000 | 47.47 | ? | 20-Feb-2013 | 1990 | 28-Oct-2020 | 1,182 | $888 | Renovated/updated. |
| 105 995 ROCHE POINT DRIVE | $625,000 | $787,000 | -20.58 | $879,000 | 05-Apr-2018 | 1989 | 29-Oct-2020 | 1,458 | $428 | |
| 201 175 W 4TH STREET | $470,000 | $481,000 | -2.29 | $525,000 | 02-Jul-2019 | 1990 | 29-Oct-2020 | 700 | $671 | |
| 505 2632 LIBRARY LANE | $837,500 | $692,000 | 21.03 | $859,000 | 22-Oct-2020 | 2019 | 29-Oct-2020 | 941 | $890 | |
| 310 1677 LLOYD AVENUE | $565,000 | $531,000 | 6.40 | $579,000 | 06-Oct-2020 | 2011 | 29-Oct-2020 | 665 | $849 | |
| 202 3680 BANFF COURT | $794,000 | $765,000 | 3.79 | $849,000 | 27-Jul-2020 | 1992 | 30-Oct-2020 | 1,340 | $592 | Renovated/updated. |
| 607 680 SEYLYNN CRESCENT | $945,000 | $921,000 | 2.61 | $1,148,000 | 14-Jan-2020 | 2018 | 30-Oct-2020 | 1,300 | $726 | |
| 401 408 LONSDALE AVENUE | $759,000 | $723,000 | 4.98 | $839,900 | 18-Mar-2019 | 1989 | 30-Oct-2020 | 1,001 | $758 | |
| 501 125 W 2ND STREET | $835,000 | $750,000 | 11.33 | $859,990 | 11-Jun-2020 | 1991 | 31-Oct-2020 | 1,064 | $784 | Renovated/updated. |
| 306 214 E 15TH STREET | $385,000 | $332,000 | 15.96 | $399,900 | 05-Oct-2020 | 1969 | 31-Oct-2020 | 645 | $596 | |
| 210 147 E 1ST STREET | $647,500 | $564,000 | 14.80 | $669,000 | 10-Sep-2020 | 1998 | 31-Oct-2020 | 830 | $780 | Renovated/updated. |
| 208 277 W 1ST STREET | $827,000 | $888,000 | -6.87 | $869,000 | 14-Sep-2020 | 2017 | 01-Nov-2020 | 985 | $839 | |
| 903 160 W KEITH ROAD | $690,000 | $695,000 | -0.72 | $699,900 | 06-Aug-2020 | 1996 | 01-Nov-2020 | 739 | $933 | Renovated/updated. |
| 1809 1550 FERN STREET | $508,000 | $531,000 | -4.33 | $658,000 | 19-Dec-2017 | 2015 | 02-Nov-2020 | 574 | $885 | |
| 207 137 E 1ST STREET | $726,000 | $643,000 | 12.91 | $679,000 | 26-Oct-2020 | 1998 | 02-Nov-2020 | 996 | $728 | Renovated/updated. |
| 306 333 E 1ST STREET | $675,000 | $687,000 | -1.75 | $769,000 | 24-Aug-2020 | 2000 | 03-Nov-2020 | 855 | $789 | Renovated/updated. |
| 507 2632 LIBRARY LANE | $835,000 | $693,000 | 20.49 | $848,000 | 28-Oct-2020 | 2019 | 03-Nov-2020 | 940 | $888 | |
| 702 1515 EASTERN AVENUE | $435,000 | $428,000 | 1.64 | $419,900 | 02-Nov-2020 | 1982 | 04-Nov-2020 | 703 | $618 | Renovated/updated. |
| 602 175 VICTORY SHIP WAY | $755,000 | $740,000 | 2.03 | $679,900 | 08-Sep-2016 | 2018 | 04-Nov-2020 | 635 | $1,188 | |
| 207 3151 WOODBINE DRIVE | $855,000 | $781,000 | 9.48 | $929,000 | 25-May-2020 | 1990 | 05-Nov-2020 | 1,368 | $625 | Renovated/updated. |
| 305 1150 E 29TH STREET | $515,000 | $506,000 | 1.78 | $539,000 | 14-Sep-2020 | 2002 | 05-Nov-2020 | 683 | $754 | |
| 303 1177 MARINE DRIVE | $780,000 | $728,000 | 7.14 | $848,000 | 22-Jun-2020 | 2013 | 05-Nov-2020 | 979 | $796 | |
| 101 151 W 2ND STREET | $788,000 | $714,000 | 10.36 | $865,000 | 11-Jun-2020 | 2005 | 07-Nov-2020 | 885 | $890 | |
| 315 555 W 28TH STREET | $650,000 | $571,400 | 13.76 | $639,900 | 03-Nov-2020 | 1968 | 09-Nov-2020 | 1,151 | $564 | Renovated/updated. |
12 out of 35 unrenovated resale homes sold below assessed with a median sold price of 1.78
Delta
| Address | Sold Price | Assessed | % Δ | True List Price | True List Date | Year Built | Sold Date | Sqft | Price per sqft | Notes |
|---|---|---|---|---|---|---|---|---|---|---|
| 214 4770 52A STREET | $555,000 | $571,000 | -2.80 | $588,000 | 18-Sep-2020 | 1996 | 23-Oct-2020 | 1,055 | $526 | Renovated/updated. |
| 200 1150 54A STREET | $559,000 | $500,000 | 11.80 | $629,900 | 08-Aug-2019 | 1987 | 29-Oct-2020 | 1,363 | $410 | Renovated/updated. |
| 210 4689 52A STREET | $593,000 | $520,000 | 14.04 | $675,000 | 19-May-2020 | 2012 | 29-Oct-2020 | 920 | $644 |
0 out of 1 unrenovated resale homes sold below assessed with a median sold price of 14.04
Surrey
| Address | Sold Price | Assessed | % Δ | True List Price | True List Date | Year Built | Sold Date | Sqft | Price per sqft | Notes |
|---|---|---|---|---|---|---|---|---|---|---|
| 306 13339 102A AVENUE | $334,000 | $326,000 | 2.45 | $359,000 | 27-Jul-2020 | 2009 | 18-Oct-2020 | 583 | $572 | |
| 2413 13438 CENTRAL AVENUE | $335,000 | $337,000 | -0.59 | $368,800 | 02-Jul-2020 | 2019 | 18-Oct-2020 | 388 | $863 | |
| 201 8717 160 STREET | $420,000 | $411,000 | 2.19 | $445,000 | 09-Sep-2020 | 2008 | 18-Oct-2020 | 890 | $471 | |
| 612 14333 104 AVENUE | $485,000 | $449,000 | 8.02 | $535,000 | 18-Aug-2020 | 2009 | 18-Oct-2020 | 1,113 | $435 | Renovated/updated. |
| 237 13733 107A AVENUE | $400,000 | $382,000 | 4.71 | $419,900 | 04-Jun-2019 | 2009 | 18-Oct-2020 | 852 | $469 | |
| 112 10128 132 STREET | $356,000 | $320,500 | 11.08 | $395,000 | 16-Aug-2019 | 1997 | 18-Oct-2020 | 910 | $391 | |
| 1106 10899 UNIVERSITY DRIVE | $315,000 | $304,000 | 3.62 | $319,900 | 13-Oct-2020 | 1995 | 18-Oct-2020 | 674 | $467 | |
| 111 15145 36 AVENUE | $608,000 | $589,000 | 3.23 | $649,000 | 28-Jun-2020 | 2012 | 18-Oct-2020 | 998 | $609 | |
| 405 15168 33 AVENUE | $529,000 | $477,000 | 10.90 | $339,900 | 03-Apr-2016 | 2016 | 19-Oct-2020 | 863 | $612 | |
| 214 10188 155 STREET | $418,000 | $378,000 | 10.58 | $428,000 | 09-Sep-2020 | 1997 | 19-Oct-2020 | 880 | $475 | Renovated/updated. |
| 2104 9981 WHALLEY BOULEVARD | $494,000 | $536,000 | -7.84 | $538,000 | 24-Aug-2020 | 2011 | 19-Oct-2020 | 899 | $549 | |
| 301 13321 102A AVENUE | $376,000 | $368,000 | 2.17 | $390,000 | 30-Jun-2020 | 2009 | 19-Oct-2020 | 671 | $560 | |
| 201 13316 OLD YALE ROAD | $350,000 | $353,600 | -1.02 | $359,900 | 13-Oct-2020 | 1981 | 19-Oct-2020 | 962 | $363 | Renovated/updated. |
| 3606 13495 CENTRAL AVENUE | $700,000 | $757,000 | -7.53 | $759,900 | 13-Aug-2020 | 2018 | 19-Oct-2020 | 1,023 | $684 | Renovated/updated. |
| 304 17661 58A AVENUE | $307,000 | $297,100 | 3.33 | $314,900 | 08-Oct-2020 | 1982 | 19-Oct-2020 | 903 | $339 | |
| 329 13321 102A AVENUE | $295,000 | $248,000 | 18.95 | $309,888 | 14-Oct-2020 | 2009 | 19-Oct-2020 | 437 | $675 | |
| 207 15388 105 AVENUE | $414,000 | $384,000 | 7.81 | $410,000 | 13-Oct-2020 | 2014 | 19-Oct-2020 | 737 | $561 | |
| 401 13925 FRASER HIGHWAY | $405,000 | $392,000 | 3.32 | $399,000 | 16-Oct-2020 | 2014 | 19-Oct-2020 | 721 | $561 | |
| 103 1630 154 STREET | $498,000 | $372,000 | 33.87 | $529,000 | 16-Jul-2018 | 1996 | 19-Oct-2020 | 1,038 | $479 | Renovated/updated. |
| 318 7171 121 STREET | $399,000 | $397,000 | 0.50 | $399,000 | 14-Oct-2020 | 1991 | 19-Oct-2020 | 1,162 | $343 | |
| 407 10533 UNIVERSITY DRIVE | $330,100 | $293,100 | 12.62 | $329,900 | 23-Sep-2020 | 1993 | 19-Oct-2020 | 690 | $478 | |
| 101 2970 KING GEORGE BOULEVARD | $428,000 | $333,000 | 28.53 | $428,000 | 13-Oct-2020 | 2009 | 19-Oct-2020 | 720 | $594 | |
| 107 15238 100 AVENUE | $340,000 | $301,900 | 12.62 | $299,000 | 08-Oct-2020 | 1981 | 19-Oct-2020 | 936 | $363 | |
| 110 6557 121 STREET | $332,000 | $281,000 | 18.15 | $345,000 | 01-Oct-2020 | 1997 | 20-Oct-2020 | 788 | $421 | |
| 411 2855 156 STREET | $520,000 | $691,000 | -24.75 | $565,000 | 17-Jun-2020 | 2016 | 20-Oct-2020 | 1,195 | $435 | |
| 102 15140 108 AVENUE | $350,000 | $348,200 | 0.52 | $379,900 | 01-Sep-2020 | 1993 | 20-Oct-2020 | 929 | $376 | Renovated/updated. |
| 407 13501 96 AVENUE | $286,000 | $267,900 | 6.76 | $289,900 | 19-Oct-2020 | 1983 | 20-Oct-2020 | 775 | $369 | |
| 407 1685 152A STREET | $525,000 | $404,000 | 29.95 | $549,000 | 06-Oct-2020 | 2001 | 20-Oct-2020 | 1,005 | $522 | Renovated/updated. |
| 206 15140 108 AVENUE | $432,000 | $399,000 | 8.27 | $439,900 | 01-Oct-2020 | 1993 | 20-Oct-2020 | 1,050 | $411 | Renovated/updated. |
| 303 6490 194 STREET | $695,000 | $641,000 | 8.42 | $724,900 | 27-Aug-2020 | 2019 | 20-Oct-2020 | 1,358 | $511 | |
| 307 14333 104 AVENUE | $492,000 | $394,000 | 24.87 | $499,000 | 01-Sep-2020 | 2009 | 20-Oct-2020 | 1,073 | $458 | |
| 410 9979 140 ST STREET | $343,000 | $294,100 | 16.63 | $350,000 | 22-Sep-2020 | 1996 | 20-Oct-2020 | 652 | $526 | |
| 415 9682 134 STREET | $359,000 | $368,300 | -2.53 | $389,000 | 07-Jul-2020 | 1985 | 21-Oct-2020 | 1,058 | $339 | |
| 417 15268 105 AVENUE | $331,800 | $288,400 | 15.05 | $349,000 | 05-Sep-2020 | 1995 | 21-Oct-2020 | 675 | $491 | Renovated/updated. |
| 108 12083 92A AVENUE | $320,000 | $293,000 | 9.22 | $325,900 | 27-Jul-2020 | 2003 | 21-Oct-2020 | 730 | $438 | Renovated/updated. |
| 202 12088 66 AVENUE | $370,000 | $373,000 | -0.80 | $379,900 | 14-Oct-2020 | 1995 | 21-Oct-2020 | 1,063 | $348 | |
| 313 16137 83 AVENUE | $440,000 | $365,000 | 20.55 | $450,000 | 24-Sep-2020 | 1994 | 22-Oct-2020 | 995 | $442 | Renovated/updated. |
| 410 13339 102A AVENUE | $380,000 | $375,000 | 1.33 | $389,000 | 14-Oct-2020 | 2009 | 22-Oct-2020 | 661 | $574 | |
| 208 6363 121 STREET | $410,000 | $407,000 | 0.74 | $419,999 | 08-Sep-2020 | 1994 | 22-Oct-2020 | 1,078 | $380 | Renovated/updated. |
| 210 19366 65 AVENUE | $420,000 | $403,000 | 4.22 | $424,900 | 21-Oct-2020 | 2005 | 22-Oct-2020 | 859 | $488 | |
| 4010 13750 100 AVENUE | $374,000 | $352,000 | 6.25 | $389,900 | 16-Sep-2020 | 2016 | 23-Oct-2020 | 448 | $834 | |
| 209 8115 121A STREET | $438,000 | $398,000 | 10.05 | $449,999 | 08-Oct-2020 | 1999 | 23-Oct-2020 | 985 | $444 | Renovated/updated. |
| 215 13277 108 AVENUE | $331,000 | $273,000 | 21.25 | $339,900 | 30-Sep-2020 | 2008 | 23-Oct-2020 | 592 | $559 | Renovated/updated. |
| 204 15282 19 AVENUE | $414,000 | $437,900 | -5.46 | $425,000 | 20-Oct-2020 | 1982 | 23-Oct-2020 | 1,131 | $366 | Renovated/updated. |
| 303 15265 17A AVENUE | $409,000 | $402,000 | 1.74 | $424,900 | 07-Oct-2020 | 2004 | 23-Oct-2020 | 842 | $485 | |
| 224 14968 101A AVENUE | $377,500 | $312,000 | 20.99 | $389,900 | 10-Sep-2020 | 2019 | 23-Oct-2020 | 566 | $666 | Renovated/updated. |
| 109 14935 100 AVENUE | $255,000 | $223,000 | 14.35 | $250,000 | 21-Oct-2020 | 1981 | 24-Oct-2020 | 649 | $392 | |
| 10566 HOLLY PARK LANE | $320,000 | $338,100 | -5.35 | $348,000 | 15-Aug-2020 | 1977 | 24-Oct-2020 | 850 | $376 | Renovated/updated. |
| 508 10777 UNIVERSITY DRIVE | $355,000 | $320,000 | 10.94 | $380,000 | 25-Mar-2020 | 2010 | 24-Oct-2020 | 550 | $645 | |
| 110 13958 108 AVENUE | $377,000 | $355,000 | 6.20 | $395,000 | 07-May-2019 | 2008 | 25-Oct-2020 | 738 | $510 | |
| 301 12101 80 AVENUE | $437,000 | $335,200 | 30.37 | $444,000 | 20-Oct-2020 | 1990 | 25-Oct-2020 | 1,204 | $362 | Renovated/updated. |
| 307 14859 100 AVENUE | $323,900 | $267,200 | 21.22 | $348,000 | 06-Oct-2020 | 2005 | 25-Oct-2020 | 615 | $526 | |
| 308 13525 96 AVENUE | $287,500 | $268,200 | 7.20 | $319,800 | 18-Aug-2020 | 1981 | 25-Oct-2020 | 764 | $376 | Renovated/updated. |
| 3306 13688 100 AVENUE | $380,000 | $388,000 | -2.06 | $429,879 | 10-Aug-2020 | 2011 | 26-Oct-2020 | 596 | $637 | |
| 407 10499 UNIVERSITY DRIVE | $340,000 | $326,000 | 4.29 | $212,000 | 25-Jul-2016 | 2006 | 26-Oct-2020 | 570 | $596 | |
| 201 15270 17 AVENUE | $410,000 | $468,900 | -12.56 | $448,000 | 03-May-2019 | 1984 | 27-Oct-2020 | 1,348 | $304 | |
| 104 9767 140 STREET | $390,000 | $357,300 | 9.15 | $395,000 | 05-Oct-2020 | 1991 | 27-Oct-2020 | 1,050 | $371 | Renovated/updated. |
| 407 14550 WINTER CRESCENT | $493,000 | $478,000 | 3.14 | $499,900 | 24-Jul-2020 | 2018 | 27-Oct-2020 | 890 | $553 | |
| 1012 13696 100 AVENUE | $457,500 | $424,000 | 7.90 | $474,900 | 12-Aug-2020 | 2017 | 27-Oct-2020 | 649 | $704 | |
| 204 1765 MARTIN DRIVE | $476,000 | $539,000 | -11.69 | ? | 27-May-2011 | 1993 | 27-Oct-2020 | 1,153 | $412 | |
| 201 15140 108 AVENUE | $299,000 | $292,400 | 2.26 | $329,000 | 02-Jul-2020 | 1993 | 27-Oct-2020 | 722 | $414 | |
| 405 9688 148 STREET | $397,000 | $374,000 | 6.15 | $435,000 | 01-May-2019 | 1994 | 28-Oct-2020 | 1,148 | $345 | Renovated/updated. |
| 4114 1222 KING GEORGE BOULEVARD | $360,000 | $255,000 | 41.18 | $438,800 | 21-Sep-2020 | 1997 | 28-Oct-2020 | 838 | $429 | |
| 202 5955 177B STREET | $385,000 | $301,000 | 27.91 | $399,900 | 17-Aug-2020 | 1992 | 28-Oct-2020 | 1,116 | $344 | Renovated/updated. |
| 310 10157 UNIVERSITY DRIVE | $305,000 | $245,500 | 24.24 | $319,900 | 09-Oct-2020 | 1984 | 28-Oct-2020 | 621 | $491 | Renovated/updated. |
| 403 14820 104 AVENUE | $415,000 | $369,000 | 12.47 | $424,900 | 31-Aug-2020 | 1994 | 29-Oct-2020 | 1,048 | $395 | Renovated/updated. |
| 210 13860 70 AVENUE | $380,000 | $421,000 | -9.74 | $439,300 | 12-Jun-2020 | 1995 | 29-Oct-2020 | 1,263 | $300 | |
| 305 10082 132 STREET | $365,000 | $364,400 | 0.16 | $364,900 | 22-Oct-2020 | 1994 | 29-Oct-2020 | 994 | $367 | |
| 203 9948 151 STREET | $403,000 | $358,500 | 12.41 | $439,900 | 27-Aug-2020 | 1992 | 29-Oct-2020 | 975 | $413 | Renovated/updated. |
| 502 15030 101 AVENUE | $525,000 | $476,000 | 10.29 | $538,000 | 28-Sep-2020 | 1990 | 30-Oct-2020 | 1,338 | $392 | Renovated/updated. |
| 102 14399 103 AVENUE | $312,000 | $288,100 | 8.30 | $349,000 | 15-Jan-2020 | 1994 | 30-Oct-2020 | 724 | $430 | |
| 137 19528 FRASER HIGHWAY | $317,000 | $318,300 | -0.41 | ? | 28-Sep-2010 | 1994 | 30-Oct-2020 | 871 | $363 | |
| 2306 13688 100 AVENUE | $390,000 | $374,000 | 4.28 | $399,800 | 05-Oct-2020 | 2011 | 31-Oct-2020 | 596 | $654 | |
| 322 18818 68 AVENUE | $348,000 | $399,000 | -12.78 | $399,000 | 22-Jul-2019 | 2010 | 31-Oct-2020 | 762 | $456 | |
| 4015 13696 100 AVENUE | $402,000 | $400,000 | 0.50 | $458,000 | 05-Sep-2020 | 2017 | 31-Oct-2020 | 512 | $785 | |
| 309 10698 151A STREET | $315,000 | $315,900 | -0.28 | $324,900 | 12-Feb-2020 | 1984 | 31-Oct-2020 | 906 | $347 | Renovated/updated. |
| 416 13897 FRASER HIGHWAY | $430,000 | $406,000 | 5.91 | $439,900 | 22-Oct-2020 | 2011 | 31-Oct-2020 | 808 | $532 | |
| 105 10665 139 STREET | $305,000 | $214,800 | 41.99 | $320,000 | 27-Jul-2020 | 1994 | 01-Nov-2020 | 649 | $469 | Renovated/updated. |
| 105 2960 151 STREET STREET | $505,000 | $452,000 | 11.73 | $499,900 | 27-Oct-2020 | 2018 | 01-Nov-2020 | 998 | $506 | |
| 307 15168 19 AVENUE | $395,000 | $349,000 | 13.18 | $399,000 | 27-Oct-2020 | 2009 | 01-Nov-2020 | 616 | $641 | |
| 434 13728 108 AVENUE | $320,000 | $317,200 | 0.88 | $325,000 | 26-Oct-2020 | 2012 | 01-Nov-2020 | 547 | $585 | |
| 209 6438 195A STREET | $367,500 | $329,000 | 11.70 | $369,980 | 19-Oct-2020 | 2016 | 01-Nov-2020 | 603 | $609 | |
| 311 3355 ROSEMARY HEIGHTS DRIVE | $474,000 | $487,000 | -2.67 | ? | 03-Jul-2014 | 2008 | 01-Nov-2020 | 900 | $526 | |
| 402 19320 65 AVENUE | $455,000 | $416,000 | 9.38 | $458,400 | 26-Oct-2020 | 2006 | 02-Nov-2020 | 886 | $513 | |
| 209 15765 CROYDON DRIVE | $402,000 | $349,000 | 15.19 | $424,800 | 25-Aug-2020 | 2009 | 02-Nov-2020 | 726 | $553 | |
| 313 13339 102A AVENUE | $287,000 | $243,800 | 17.72 | $338,000 | 22-Apr-2019 | 2009 | 02-Nov-2020 | 474 | $605 | |
| 211 13771 72A AVENUE | $361,000 | $316,900 | 13.92 | $330,000 | 26-Oct-2020 | 1991 | 02-Nov-2020 | 937 | $385 | Renovated/updated. |
| 111 13925 FRASER HIGHWAY | $320,000 | $268,500 | 19.18 | $300,000 | 28-Oct-2020 | 2014 | 03-Nov-2020 | 513 | $623 | |
| 206 10038 150 STREET | $410,000 | $370,300 | 10.72 | $399,999 | 29-Oct-2020 | 1990 | 03-Nov-2020 | 1,033 | $396 | Renovated/updated. |
| 2308 13308 CENTRAL AVENUE | $392,000 | $368,000 | 6.52 | $400,000 | 30-Oct-2020 | 2018 | 03-Nov-2020 | 461 | $850 | |
| 106 9635 121 STREET | $300,000 | $190,500 | 57.48 | $339,000 | 24-Aug-2020 | 1984 | 03-Nov-2020 | 750 | $400 | Renovated/updated. |
| 208 2855 152 STREET | $415,000 | $378,200 | 9.73 | $400,000 | 03-Jun-2019 | 1994 | 04-Nov-2020 | 933 | $444 | Renovated/updated. |
| 1213 13438 CENTRAL AVENUE | $309,000 | $313,000 | -1.28 | $349,000 | 12-Aug-2020 | 2019 | 04-Nov-2020 | 389 | $794 |
11 out of 58 unrenovated resale homes sold below assessed with a median sold price of 4.50
Port Moody
| Address | Sold Price | Assessed | % Δ | True List Price | True List Date | Year Built | Sold Date | Sqft | Price per sqft | Notes |
|---|---|---|---|---|---|---|---|---|---|---|
| 212 300 KLAHANIE DRIVE | $689,800 | $661,000 | 4.36 | $689,800 | 17-Sep-2020 | 2005 | 18-Oct-2020 | 1,028 | $671 | |
| 311 200 CAPILANO ROAD | $627,000 | $564,000 | 11.17 | $609,000 | 13-Oct-2020 | 2005 | 21-Oct-2020 | 940 | $667 | Renovated/updated. |
| 103 3099 TERRAVISTA PLACE | $445,000 | $403,000 | 10.42 | $450,000 | 19-Oct-2020 | 1998 | 23-Oct-2020 | 750 | $593 | Renovated/updated. |
| 208 200 KLAHANIE DRIVE | $580,000 | $568,000 | 2.11 | $599,900 | 07-Aug-2020 | 2005 | 23-Oct-2020 | 839 | $691 | Renovated/updated. |
| 411 3142 ST JOHNS STREET | $412,000 | $393,800 | 4.62 | $445,000 | 22-Jun-2020 | 2003 | 23-Oct-2020 | 605 | $680 | |
| 154 200 WESTHILL PLACE | $320,000 | $258,100 | 23.98 | $325,000 | 22-Oct-2020 | 1970 | 25-Oct-2020 | 685 | $467 | |
| 1207 660 NOOTKA WAY | $593,000 | $546,000 | 8.61 | $595,000 | 22-Oct-2020 | 2009 | 25-Oct-2020 | 888 | $667 | Renovated/updated. |
| 212 3142 ST JOHNS STREET | $420,000 | $381,600 | 10.06 | $433,800 | 18-Aug-2020 | 2003 | 26-Oct-2020 | 623 | $674 | Renovated/updated. |
| 319 100 CAPILANO ROAD | $585,000 | $564,000 | 3.72 | $599,800 | 13-Jul-2020 | 2005 | 28-Oct-2020 | 902 | $648 | |
| 601 301 CAPILANO ROAD | $628,000 | $613,000 | 2.45 | $634,800 | 20-Oct-2020 | 2012 | 28-Oct-2020 | 887 | $708 | |
| 2306 301 CAPILANO ROAD | $668,000 | $709,000 | -5.78 | $769,900 | 23-Apr-2019 | 2012 | 28-Oct-2020 | 940 | $710 | |
| 2012 84 GRANT STREET | $522,000 | $487,000 | 7.19 | $535,000 | 21-Sep-2020 | 2006 | 29-Oct-2020 | 778 | $670 | |
| 212 2525 CLARKE STREET | $549,000 | $517,000 | 6.19 | $575,000 | 18-Jun-2020 | 2018 | 31-Oct-2020 | 854 | $642 | |
| 405 400 KLAHANIE DRIVE | $640,000 | $598,000 | 7.02 | $679,900 | 14-Oct-2020 | 2005 | 02-Nov-2020 | 864 | $740 | Renovated/updated. |
| 203 195 MARY STREET | $410,000 | $384,800 | 6.55 | $419,900 | 26-Oct-2020 | 1969 | 02-Nov-2020 | 955 | $429 | Renovated/updated. |
| 201 3142 ST JOHNS STREET | $483,000 | $477,000 | 1.26 | $498,000 | 29-Sep-2020 | 2003 | 03-Nov-2020 | 811 | $595 | |
| 202 3148 ST JOHNS STREET | $625,000 | $595,000 | 5.04 | $649,900 | 16-Oct-2020 | 2004 | 03-Nov-2020 | 1,088 | $574 |
1 out of 10 unrenovated resale homes sold below assessed with a median sold price of 4.49
Coquitlam
| Address | Sold Price | Assessed | % Δ | True List Price | True List Date | Year Built | Sold Date | Sqft | Price per sqft | Notes |
|---|---|---|---|---|---|---|---|---|---|---|
| 201 455 BROMLEY STREET | $490,000 | $489,000 | 0.20 | $549,900 | 01-Jun-2020 | 1989 | 18-Oct-2020 | 1,221 | $401 | Renovated/updated. |
| 214 932 ROBINSON STREET | $379,000 | $308,000 | 23.05 | $379,000 | 22-Sep-2020 | 1983 | 18-Oct-2020 | 706 | $536 | Renovated/updated. |
| 905 511 ROCHESTER AVENUE | $435,000 | $404,000 | 7.67 | $449,800 | 01-Sep-2020 | 2007 | 18-Oct-2020 | 657 | $662 | |
| 212 607 COTTONWOOD AVENUE | $520,000 | $496,000 | 4.84 | $559,000 | 15-Sep-2020 | 2017 | 18-Oct-2020 | 773 | $672 | |
| 1804 3100 WINDSOR GATE | $628,000 | $598,000 | 5.02 | $638,000 | 23-Sep-2020 | 2018 | 19-Oct-2020 | 827 | $759 | |
| 106 2969 WHISPER WAY | $550,000 | $477,000 | 15.30 | $625,000 | 05-Dec-2018 | 2005 | 19-Oct-2020 | 864 | $636 | Renovated/updated. |
| 2701 657 WHITING WAY | $522,000 | $447,000 | 16.78 | $529,900 | 15-Oct-2020 | 2019 | 19-Oct-2020 | 593 | $880 | Brand New. |
| 1202 1180 PINETREE WAY | $518,800 | $509,000 | 1.93 | $596,000 | 15-May-2019 | 1990 | 20-Oct-2020 | 916 | $566 | Renovated/updated. |
| 205 3050 DAYANEE SPRINGS BOULEVARD | $619,000 | $584,000 | 5.99 | ? | 02-Nov-2010 | 2008 | 20-Oct-2020 | 1,001 | $618 | |
| 71 202 LAVAL STREET | $499,000 | $467,000 | 6.85 | $539,000 | 31-Aug-2020 | 1993 | 20-Oct-2020 | 1,172 | $425 | Renovated/updated. |
| 407 3156 DAYANEE SPRINGS BOULEVARD | $435,000 | $409,000 | 6.36 | $440,000 | 08-Oct-2020 | 2012 | 20-Oct-2020 | 620 | $701 | |
| 206 1242 TOWN CENTRE BOULEVARD | $410,000 | $401,000 | 2.24 | $448,900 | 08-Aug-2018 | 1996 | 21-Oct-2020 | 678 | $604 | |
| 212 1154 WESTWOOD STREET | $462,000 | $416,000 | 11.06 | $509,000 | 03-Sep-2020 | 1990 | 22-Oct-2020 | 947 | $487 | Renovated/updated. |
| 403 1152 WINDSOR MEWS | $535,000 | $540,000 | -0.93 | $434,900 | 25-Sep-2016 | 2016 | 22-Oct-2020 | 864 | $619 | |
| 2201 602 COMO LAKE AVENUE | $498,000 | $417,000 | 19.42 | $499,900 | 20-Oct-2020 | 2017 | 23-Oct-2020 | 578 | $861 | |
| 103 1330 GENEST WAY | $566,000 | $536,000 | 5.60 | $569,000 | 09-Oct-2019 | 2008 | 23-Oct-2020 | 952 | $594 | |
| 803 1196 PIPELINE ROAD | $543,000 | $492,000 | 10.37 | $549,000 | 20-Oct-2020 | 1997 | 24-Oct-2020 | 1,013 | $536 | |
| 508 555 DELESTRE AVENUE | $325,000 | $274,700 | 18.31 | $349,000 | 27-Jul-2020 | 2008 | 24-Oct-2020 | 373 | $871 | |
| 110 711 BRESLAY STREET | $493,000 | $507,000 | -2.76 | $519,000 | 09-Sep-2020 | 2017 | 24-Oct-2020 | 643 | $766 | |
| 513 3132 DAYANEE SPRINGS BOULEVARD | $575,000 | $515,000 | 11.65 | $589,000 | 28-Sep-2020 | 2009 | 25-Oct-2020 | 928 | $619 | |
| 216 553 FOSTER AVENUE | $401,000 | $419,000 | -4.30 | $480,000 | 07-Aug-2020 | 2012 | 25-Oct-2020 | 611 | $656 | |
| 511 1152 WINDSOR MEWS | $630,000 | $564,000 | 11.70 | $499,900 | 25-Nov-2016 | 2016 | 26-Oct-2020 | 900 | $700 | Renovated/updated. |
| 308 1185 THE HIGH STREET | $435,000 | $418,000 | 4.07 | $448,800 | 04-Aug-2020 | 2009 | 26-Oct-2020 | 582 | $747 | |
| 1103 1185 THE HIGH STREET | $458,000 | $437,000 | 4.81 | $490,000 | 04-Sep-2020 | 2009 | 26-Oct-2020 | 576 | $795 | |
| 607 3093 WINDSOR GATE | $576,000 | $519,000 | 10.98 | $574,000 | 26-Oct-2020 | 2016 | 27-Oct-2020 | 834 | $690 | |
| 2202 3102 WINDSOR GATE | $625,000 | $559,000 | 11.81 | $639,800 | 21-Oct-2020 | 2012 | 27-Oct-2020 | 772 | $809 | |
| 109 1438 PARKWAY BOULEVARD | $512,000 | $521,000 | -1.73 | $519,000 | 19-Oct-2020 | 1999 | 28-Oct-2020 | 980 | $522 | |
| 1702 530 WHITING WAY | $630,000 | $622,000 | 1.29 | $685,000 | 11-Jun-2020 | 2019 | 28-Oct-2020 | 802 | $785 | |
| 313 295 SCHOOLHOUSE STREET | $375,000 | $349,000 | 7.45 | $359,900 | 19-Oct-2020 | 1993 | 28-Oct-2020 | 710 | $528 | Renovated/updated. |
| 3403 657 WHITING WAY | $505,000 | $430,100 | 17.41 | $528,800 | 22-Oct-2020 | 2019 | 28-Oct-2020 | 545 | $926 | Brand New. |
| 3108 2975 ATLANTIC AVENUE | $570,000 | $563,000 | 1.24 | $579,900 | 08-Oct-2020 | 2014 | 29-Oct-2020 | 831 | $685 | |
| 202 2959 GLEN DRIVE | $520,000 | $470,000 | 10.64 | $539,900 | 03-Aug-2020 | 2009 | 29-Oct-2020 | 886 | $586 | |
| 2503 3102 WINDSOR GATE | $662,800 | $679,000 | -2.39 | $599,999 | 15-Oct-2020 | 2012 | 29-Oct-2020 | 931 | $711 | |
| 407 518 WHITING WAY | $610,000 | $609,000 | 0.16 | $615,500 | 20-Oct-2020 | 2018 | 31-Oct-2020 | 825 | $739 | |
| 507 575 DELESTRE AVENUE | $369,000 | $341,000 | 8.21 | $398,800 | 28-Sep-2020 | 2008 | 01-Nov-2020 | 445 | $829 | |
| 305 3100 WINDSOR GATE | $690,000 | $631,000 | 9.35 | $704,999 | 21-Jul-2020 | 2018 | 02-Nov-2020 | 965 | $715 | |
| 211 1438 PARKWAY BOULEVARD | $545,000 | $538,000 | 1.30 | ? | 28-Apr-2011 | 1999 | 02-Nov-2020 | 1,163 | $468 | Renovated/updated. |
| 208 1103 HOWIE AVENUE | $320,000 | $290,500 | 10.15 | $329,000 | 03-Oct-2020 | 1979 | 02-Nov-2020 | 630 | $507 | Renovated/updated. |
| 105 2968 BURLINGTON DRIVE | $395,000 | $414,000 | -4.59 | $399,900 | 19-Oct-2020 | 1993 | 03-Nov-2020 | 881 | $448 | |
| 211 1000 KING ALBERT AVENUE | $280,000 | $265,600 | 5.42 | $288,800 | 14-Oct-2020 | 1969 | 03-Nov-2020 | 625 | $448 | |
| 508 602 COMO LAKE AVENUE | $487,500 | $380,000 | 28.29 | $499,900 | 05-Oct-2020 | 2017 | 04-Nov-2020 | 605 | $805 | |
| 2603 1188 PINETREE WAY | $498,800 | $468,000 | 6.58 | $498,800 | 02-Nov-2020 | 2016 | 04-Nov-2020 | 610 | $817 | |
| 802 2979 GLEN DRIVE | $495,000 | $499,000 | -0.80 | $495,000 | 03-Nov-2020 | 2007 | 05-Nov-2020 | 737 | $671 | |
| 112 607 COTTONWOOD AVENUE | $615,000 | $523,000 | 17.59 | $669,900 | 21-Oct-2020 | 2017 | 12-Nov-2020 | 850 | $723 |
7 out of 31 unrenovated resale homes sold below assessed with a median sold price of 5.60
Port Coquitlam
| Address | Sold Price | Assessed | % Δ | True List Price | True List Date | Year Built | Sold Date | Sqft | Price per sqft | Notes |
|---|---|---|---|---|---|---|---|---|---|---|
| 316 2627 SHAUGHNESSY STREET | $542,000 | $482,000 | 12.45 | $560,000 | 30-Sep-2020 | 2008 | 18-Oct-2020 | 1,089 | $497 | |
| 308 2473 ATKINS AVENUE | $323,000 | $289,000 | 11.76 | $299,800 | 24-Sep-2020 | 2012 | 19-Oct-2020 | 501 | $644 | |
| 401 2378 WILSON AVENUE | $405,000 | $362,000 | 11.88 | $444,900 | 02-Jun-2020 | 1986 | 20-Oct-2020 | 998 | $405 | |
| 407 2307 RANGER LANE | $585,000 | $510,000 | 14.71 | $599,900 | 05-Oct-2020 | 2016 | 20-Oct-2020 | 900 | $650 | |
| 101 2343 ATKINS AVENUE | $430,000 | $380,000 | 13.16 | $439,900 | 13-Oct-2020 | 2011 | 20-Oct-2020 | 684 | $628 | |
| 304 1999 SUFFOLK AVENUE | $395,000 | $407,000 | -2.95 | $409,500 | 27-Jul-2020 | 1997 | 21-Oct-2020 | 829 | $476 | |
| 208 2346 MCALLISTER AVENUE | $392,000 | $391,000 | 0.26 | $389,900 | 14-Oct-2020 | 2006 | 21-Oct-2020 | 732 | $535 | |
| 311 2339 SHAUGHNESSY STREET | $426,000 | $438,000 | -2.74 | $449,900 | 17-Sep-2020 | 1990 | 23-Oct-2020 | 1,112 | $383 | |
| 312 2484 WILSON AVENUE | $520,000 | $512,000 | 1.56 | $547,000 | 15-Jul-2020 | 2008 | 23-Oct-2020 | 1,043 | $498 | |
| 301 2109 ROWLAND STREET | $450,000 | $367,000 | 22.62 | $265,000 | 21-Oct-2014 | 1994 | 25-Oct-2020 | 1,023 | $439 | Renovated/updated. |
| 103 2485 ATKINS AVENUE | $445,000 | $398,000 | 11.81 | $399,999 | 13-Oct-2020 | 1995 | 25-Oct-2020 | 905 | $491 | Renovated/updated. |
| 103 2437 WELCHER AVENUE | $392,500 | $365,000 | 7.53 | $424,900 | 01-May-2020 | 1994 | 25-Oct-2020 | 837 | $468 | |
| 101 2336 WHYTE AVENUE | $530,000 | $499,000 | 6.21 | $539,900 | 19-Oct-2020 | 2008 | 27-Oct-2020 | 1,034 | $512 | Renovated/updated. |
| 206 2484 WILSON AVENUE | $561,000 | $483,000 | 16.15 | $530,000 | 19-Oct-2020 | 2008 | 27-Oct-2020 | 952 | $589 | Renovated/updated. |
| 402 1558 GRANT AVENUE | $425,000 | $412,000 | 3.16 | $407,000 | 27-Oct-2020 | 1996 | 31-Oct-2020 | 1,146 | $370 |
2 out of 11 unrenovated resale homes sold below assessed with a median sold price of 7.53
Pitt Meadows
| Address | Sold Price | Assessed | % Δ | True List Price | True List Date | Year Built | Sold Date | Sqft | Price per sqft | Notes |
|---|---|---|---|---|---|---|---|---|---|---|
| 211 12565 190A STREET | $374,000 | $357,000 | 4.76 | $389,900 | 02-Oct-2020 | 2012 | 18-Oct-2020 | 642 | $582 | |
| 109 19142 122 AVENUE | $445,000 | $404,000 | 10.15 | $449,900 | 21-Sep-2020 | 1994 | 22-Oct-2020 | 1,129 | $394 | Renovated/updated. |
0 out of 1 unrenovated resale homes sold below assessed with a median sold price of 4.76
Langley
| Address | Sold Price | Assessed | % Δ | True List Price | True List Date | Year Built | Sold Date | Sqft | Price per sqft | Notes |
|---|---|---|---|---|---|---|---|---|---|---|
| 304 5638 201A STREET | $490,000 | $445,000 | 10.11 | $529,000 | 15-Jul-2020 | 2019 | 19-Oct-2020 | 982 | $498 | |
| 304 23189 FRANCIS AVENUE | $1,717,000 | $1,482,000 | 15.86 | $1,717,000 | 13-Oct-2020 | 2018 | 19-Oct-2020 | 1,664 | $1,031 | |
| 314 21009 56 AVENUE | $385,000 | $390,000 | -1.28 | $399,000 | 09-Sep-2020 | 2011 | 21-Oct-2020 | 848 | $454 | |
| 326 22323 48 AVENUE | $505,000 | $468,000 | 7.91 | $529,900 | 15-Sep-2020 | 2010 | 21-Oct-2020 | 1,053 | $479 | |
| 202 20268 54 AVENUE | $323,000 | $307,000 | 5.21 | $324,900 | 13-Oct-2020 | 1997 | 22-Oct-2020 | 893 | $361 | Renovated/updated. |
| 125 8157 207 STREET | $549,900 | $468,000 | 17.50 | $599,999 | 26-Mar-2020 | 2016 | 23-Oct-2020 | 1,086 | $506 | |
| 207 23189 FRANCIS AVENUE | $915,000 | $741,000 | 23.48 | $849,900 | 16-Apr-2018 | 2018 | 23-Oct-2020 | 1,020 | $897 | |
| 113 5765 GLOVER ROAD | $350,000 | $363,100 | -3.61 | $374,800 | 29-Jul-2020 | 1995 | 23-Oct-2020 | 1,098 | $318 | Renovated/updated. |
| 340 22020 49 AVENUE | $444,000 | $387,000 | 14.73 | $449,900 | 20-Oct-2020 | 1997 | 24-Oct-2020 | 1,090 | $407 | Renovated/updated. |
1 out of 5 unrenovated resale homes sold below assessed with a median sold price of 15.86
Maple Ridge
| Address | Sold Price | Assessed | % Δ | True List Price | True List Date | Year Built | Sold Date | Sqft | Price per sqft | Notes |
|---|---|---|---|---|---|---|---|---|---|---|
| 105 11519 BURNETT STREET | $377,450 | $376,000 | 0.39 | $389,900 | 28-Sep-2020 | 1995 | 20-Oct-2020 | 1,154 | $327 | Renovated/updated. |
| 307 12075 228 STREET | $390,000 | $392,000 | -0.51 | $399,900 | 26-Aug-2020 | 2008 | 22-Oct-2020 | 978 | $398 |
1 out of 1 unrenovated resale homes sold below assessed with a median sold price of -0.51
White Rock
| Address | Sold Price | Assessed | % Δ | True List Price | True List Date | Year Built | Sold Date | Sqft | Price per sqft | Notes |
|---|
0 out of 0 unrenovated resale homes sold below assessed with a median sold price of 0.00
References
| 1. | ↑ | https://faculty.wharton.upenn.edu/wp-content/uploads/2013/05/Brown_2013_House_Price_Index_Methodology_1.pdf |