


Metro Vancouver detached prices plummeting in May
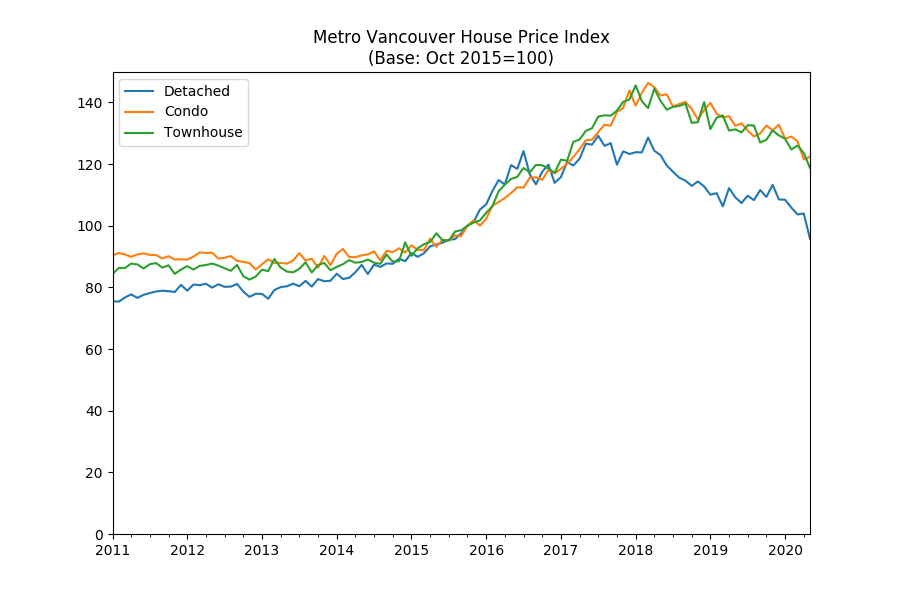
Metro Vancouver detached home prices are in free fall in May as economic turbulence caused by COVID-19 related lock down measures continue to rock the region’s housing market.
The OpenHousing House Price Index for detached properties – calculated using the generally-accepted and transparent repeat sales or Case-Shiller method[1]https://faculty.wharton.upenn.edu/wp-content/uploads/2013/05/Brown_2013_House_Price_Index_Methodology_1.pdf – fell 12.34% year-over-year, the May mid-month projection update shows.
This represents a 7.90% month-over-month contraction.
Here’s what detached sales looked like in the last 30 days.
Vancouver
| Address | Sold Price | Assessed | % Δ | True List Price | True List Date | Year Built | Sold Date | Sqft | Price per sqft | Notes |
|---|---|---|---|---|---|---|---|---|---|---|
| 5638 MCMASTER ROAD | $5,500,000 | $6,313,000 | -12.88 | $12,998,000 | 02-Oct-2017 | 2003 | 22-Apr-2020 | 5,448 | $1,009 | |
| 4703 COMMERCIAL STREET | $1,333,000 | $1,173,900 | 13.55 | $1,250,000 | 15-Apr-2020 | 1963 | 22-Apr-2020 | 2,130 | $625 | |
| 3164 W KING EDWARD AVENUE | $2,050,000 | $1,744,400 | 17.52 | $2,199,000 | 04-Apr-2020 | 1973 | 23-Apr-2020 | 3,050 | $672 | |
| 3025 WATERLOO STREET | $2,250,000 | $2,170,000 | 3.69 | $2,298,000 | 14-Apr-2020 | 1990 | 24-Apr-2020 | 2,259 | $996 | |
| 2506 GARDEN DRIVE | $1,475,000 | $1,084,200 | 36.05 | $2,700,000 | 14-Feb-2017 | 1946 | 24-Apr-2020 | 1,720 | $857 | |
| 63 W 22ND AVENUE | $3,275,000 | $3,015,000 | 8.62 | $3,898,000 | 27-Jan-2020 | 1997 | 24-Apr-2020 | 3,627 | $902 | |
| 2408 W 20TH AVENUE | $3,700,000 | $3,706,000 | -0.16 | $4,369,000 | 13-Jan-2020 | 1996 | 25-Apr-2020 | 3,943 | $938 | |
| 3636 W 15TH AVENUE | $1,480,000 | $1,230,000 | 20.33 | $1,480,000 | 16-Mar-2020 | 1987 | 26-Apr-2020 | 1,005 | $1,472 | |
| 3247 W 6TH AVENUE | $2,255,000 | $1,839,000 | 22.62 | $2,648,000 | 30-Jan-2020 | 1927 | 26-Apr-2020 | 2,366 | $953 | Renovated/updated. |
| 7642 OSLER STREET | $1,661,000 | $1,796,700 | -7.55 | $2,058,000 | 22-Jul-2019 | 1945 | 27-Apr-2020 | 1,678 | $989 | |
| 3191 W 38TH AVENUE | $2,898,000 | $2,569,700 | 12.78 | $2,898,000 | 20-Apr-2020 | 1924 | 27-Apr-2020 | 2,792 | $1,037 | Renovated/updated. |
| 2343 E 2ND AVENUE | $1,450,000 | $1,472,000 | -1.49 | $1,499,000 | 23-Mar-2020 | 1926 | 27-Apr-2020 | 2,106 | $688 | Renovated/updated. |
| 2451 TRIUMPH STREET | $1,250,000 | $1,217,200 | 2.69 | $1,200,000 | 14-Apr-2020 | 1931 | 27-Apr-2020 | 2,554 | $489 | Renovated/updated. |
| 4435 PRINCE ALBERT STREET | $1,319,000 | $1,271,400 | 3.74 | $1,088,000 | 20-Apr-2020 | 1910 | 27-Apr-2020 | 1,533 | $860 | |
| 5612 OLYMPIC STREET | $2,950,000 | $2,670,000 | 10.49 | $3,498,000 | 23-Oct-2019 | 1930 | 27-Apr-2020 | 3,643 | $809 | Renovated/updated. |
| 2128 W 21ST AVENUE | $2,760,000 | $2,767,400 | -0.27 | $3,899,900 | 08-Apr-2016 | 1930 | 27-Apr-2020 | 1,616 | $1,707 | |
| 2579 ETON STREET | $1,300,000 | $1,236,200 | 5.16 | $1,375,000 | 19-Mar-2020 | 1928 | 28-Apr-2020 | 2,322 | $559 | |
| 2120 E PENDER STREET | $1,928,000 | $1,791,000 | 7.65 | $1,588,000 | 20-Apr-2020 | 1912 | 28-Apr-2020 | 2,502 | $770 | Renovated/updated. |
| 1322 E 54TH AVENUE | $1,175,000 | $1,207,200 | -2.67 | $1,298,000 | 03-Apr-2020 | 1963 | 28-Apr-2020 | 2,256 | $520 | |
| 4391 ST. CATHERINES STREET | $1,460,000 | $1,363,100 | 7.11 | $1,398,000 | 27-Apr-2020 | 1946 | 29-Apr-2020 | 974 | $1,498 | |
| 7749 MUNROE CRESCENT | $1,580,000 | $1,422,000 | 11.11 | $1,688,000 | 27-Apr-2020 | 1973 | 30-Apr-2020 | 2,895 | $545 | |
| 3333 VENABLES STREET | $1,357,000 | $1,170,000 | 15.98 | $1,599,900 | 11-Mar-2020 | 1998 | 01-May-2020 | 1,993 | $680 | Renovated/updated. |
| 2895 ALAMEIN AVENUE | $2,955,000 | $2,421,000 | 22.06 | $2,998,000 | 23-Mar-2020 | 1953 | 01-May-2020 | 2,588 | $1,141 | |
| 7567 ONTARIO STREET | $2,028,000 | $1,768,000 | 14.71 | $1,980,000 | 27-Apr-2020 | 1990 | 03-May-2020 | 2,300 | $881 | Renovated/updated. |
| 3691 W 48TH AVENUE | $3,198,000 | $2,620,000 | 22.06 | $3,198,000 | 29-Apr-2020 | 1997 | 03-May-2020 | 2,152 | $1,486 | Renovated/updated. |
| 1635 E 57TH AVENUE | $1,270,000 | $1,116,400 | 13.76 | $1,399,900 | 22-Mar-2017 | 1953 | 03-May-2020 | 1,572 | $807 | |
| 2919 E 54TH AVENUE | $1,288,000 | $1,106,700 | 16.38 | $1,168,000 | 08-Sep-2019 | 1954 | 03-May-2020 | 690 | $1,866 | |
| 3215 GRANT STREET | $1,420,000 | $1,340,000 | 5.97 | $1,499,000 | 19-Mar-2020 | 1985 | 03-May-2020 | 2,474 | $573 | Renovated/updated. |
| 50 E 56TH AVENUE | $2,468,000 | $1,592,000 | 55.03 | $2,468,000 | 28-Apr-2020 | 2019 | 04-May-2020 | 2,586 | $954 | Brand New. |
| 6526 DAWSON STREET | $2,630,000 | $2,622,000 | 0.31 | $2,888,000 | 11-Jun-2019 | 2012 | 04-May-2020 | 4,704 | $559 | |
| 1324 CYPRESS STREET | $3,150,000 | $2,985,000 | 5.53 | $3,298,000 | 21-Apr-2020 | 1912 | 05-May-2020 | 3,285 | $958 | Renovated/updated. |
| 495 E 60TH AVENUE | $1,240,000 | $1,095,100 | 13.23 | $1,249,000 | 01-May-2020 | 1949 | 05-May-2020 | 1,600 | $775 | |
| 5163 ELGIN STREET | $2,300,000 | $1,787,000 | 28.71 | $2,760,000 | 16-Nov-2018 | 2018 | 05-May-2020 | 2,251 | $1,021 | |
| 3044 GLEN DRIVE | $1,574,000 | $1,530,000 | 2.88 | $1,798,000 | 14-Feb-2020 | 1912 | 05-May-2020 | 2,868 | $548 | Renovated/updated. |
| 5622 CULLODEN STREET | $1,450,000 | $1,362,400 | 6.43 | $1,549,000 | 17-Mar-2020 | 1948 | 05-May-2020 | 1,668 | $869 | |
| 3445 W 30TH AVENUE | $2,193,990 | $1,881,700 | 16.60 | $2,300,000 | 24-Apr-2020 | 1935 | 06-May-2020 | 1,749 | $1,254 | Renovated/updated. |
| 2889 MCGILL STREET | $960,000 | $1,038,700 | -7.58 | $1,098,000 | 17-Mar-2020 | 1948 | 06-May-2020 | 800 | $1,200 | |
| 757 PRIOR STREET | $1,848,000 | $1,261,000 | 46.55 | $1,988,000 | 13-Mar-2020 | 1905 | 07-May-2020 | 3,059 | $604 | Renovated/updated. |
| 2238 W 36TH AVENUE | $3,405,000 | $3,250,400 | 4.76 | $2,998,000 | 30-Apr-2020 | 1925 | 07-May-2020 | 878 | $3,878 | Renovated/updated. |
| 545 E 46TH AVENUE | $1,300,000 | $1,353,000 | -3.92 | $1,450,000 | 05-Apr-2020 | 1908 | 07-May-2020 | 3,222 | $403 | |
| 531 E 18TH AVENUE | $1,449,000 | $1,298,400 | 11.60 | $1,449,000 | 05-May-2020 | 1959 | 08-May-2020 | 2,349 | $616 | Renovated/updated. |
| 3730 W 15TH AVENUE | $2,110,000 | $1,989,000 | 6.08 | $2,498,000 | 09-Mar-2020 | 1915 | 08-May-2020 | 2,165 | $974 | |
| 3804 W 22ND AVENUE | $2,470,000 | $2,088,400 | 18.27 | $2,198,000 | 05-May-2020 | 1926 | 09-May-2020 | 2,450 | $1,008 | |
| 1691 W 40TH AVENUE | $6,600,000 | $6,498,000 | 1.57 | $11,880,000 | 08-Jun-2018 | 1931 | 09-May-2020 | 5,562 | $1,186 | |
| 304 E 37TH AVENUE | $1,650,000 | $1,399,000 | 17.94 | $1,679,000 | 30-Mar-2020 | 1931 | 09-May-2020 | 2,034 | $811 | |
| 4014 W 29TH AVENUE | $3,408,000 | $3,142,600 | 8.45 | $3,188,000 | 08-May-2020 | 1950 | 11-May-2020 | 3,045 | $1,119 | |
| 3275 W 22ND AVENUE | $4,100,000 | $4,302,000 | -4.70 | $4,188,000 | 08-May-2017 | 2018 | 11-May-2020 | 3,443 | $1,190 | |
| 8116 LABURNUM STREET | $3,610,000 | $3,074,000 | 17.44 | $3,498,000 | 05-May-2020 | 1923 | 11-May-2020 | 4,537 | $795 | Renovated/updated. |
| 8221 CARTIER STREET | $1,713,000 | $1,539,900 | 11.24 | $1,669,000 | 06-May-2020 | 1927 | 12-May-2020 | 1,831 | $935 | Renovated/updated. |
| 3875 W 14TH AVENUE | $5,000,000 | $4,532,000 | 10.33 | $5,590,000 | 09-Dec-2019 | 2016 | 13-May-2020 | 3,989 | $1,253 | |
| 4544 W 13TH AVENUE | $2,350,000 | $2,208,000 | 6.43 | $2,398,000 | 12-May-2020 | 1930 | 19-May-2020 | 2,694 | $872 | |
| 3375 EUCLID AVE AVENUE | $1,180,000 | $1,136,000 | 3.87 | $1,150,000 | 07-May-2020 | 1986 | 19-May-2020 | 2,275 | $518 |
8 out of 33 used unrenovated homes sold below assessed with a median sold price of 6.43
Richmond
| Address | Sold Price | Assessed | % Δ | True List Price | True List Date | Year Built | Sold Date | Sqft | Price per sqft | Notes |
|---|---|---|---|---|---|---|---|---|---|---|
| 8611 BOWCOCK ROAD | $1,470,000 | $1,788,600 | -17.81 | $1,788,000 | 14-Aug-2019 | 1954 | 22-Apr-2020 | 2,382 | $617 | |
| 10451 AINTREE CRESCENT | $2,000,000 | $1,943,000 | 2.93 | $2,488,000 | 28-Dec-2018 | 2009 | 23-Apr-2020 | 3,807 | $525 | |
| 10819 SOUTHRIDGE ROAD | $1,238,100 | $1,252,000 | -1.11 | $1,628,000 | 09-Apr-2018 | 2016 | 23-Apr-2020 | 2,180 | $567 | |
| 7311 LINDSAY ROAD | $1,907,000 | $1,840,000 | 3.64 | $2,486,000 | 17-Apr-2018 | 2015 | 24-Apr-2020 | 2,774 | $687 | |
| 3933 GARRY STREET | $1,410,000 | $1,339,000 | 5.30 | $1,459,000 | 25-Mar-2020 | 2002 | 25-Apr-2020 | 2,264 | $622 | |
| 5260 LANCING ROAD | $3,761,900 | $2,721,000 | 38.25 | $2,758,000 | 29-Jun-2018 | 2019 | 27-Apr-2020 | 4,437 | $847 | Brand New. |
| 10668 CANSO CRESCENT | $1,060,000 | $1,066,300 | -0.59 | $1,049,000 | 23-Apr-2020 | 1980 | 29-Apr-2020 | 1,354 | $782 | Renovated/updated. |
| 4455 WESTMINSTER HIGHWAY | $1,540,000 | $1,379,000 | 11.68 | $1,888,000 | 11-Sep-2018 | 1989 | 30-Apr-2020 | 3,338 | $461 | |
| 10151 RUSKIN ROAD | $2,400,000 | $2,573,000 | -6.72 | $3,298,000 | 03-Nov-2017 | 2016 | 01-May-2020 | 3,772 | $636 | |
| 13291 BLUNDELL ROAD | $1,500,000 | $1,431,800 | 4.76 | $1,498,000 | 01-May-2020 | 1964 | 03-May-2020 | 2,360 | $635 | |
| 3691 HUNT STREET | $1,200,000 | $1,133,300 | 5.89 | $1,550,000 | 03-Apr-2019 | 1988 | 05-May-2020 | 1,884 | $636 | |
| 3768 BARMOND AVENUE | $2,250,000 | $2,196,000 | 2.46 | $2,880,000 | 09-Mar-2018 | 2011 | 05-May-2020 | 3,626 | $620 | Renovated/updated. |
| 3900 BROADWAY STREET | $1,180,000 | $1,136,500 | 3.83 | $1,220,000 | 16-Apr-2020 | 1987 | 07-May-2020 | 1,993 | $592 | Renovated/updated. |
| 9135 STEVESTON HIGHWAY | $1,188,570 | $1,063,000 | 11.81 | $1,395,000 | 03-Feb-2020 | 2019 | 08-May-2020 | 2,039 | $582 | Brand New. |
| 11051 KINGFISHER DRIVE | $1,400,000 | $1,462,000 | -4.24 | $1,450,000 | 06-May-2020 | 1980 | 08-May-2020 | 2,763 | $506 | Renovated/updated. |
| 3162 REGENT STREET | $1,780,000 | $1,546,000 | 15.14 | $1,799,000 | 08-May-2020 | 2002 | 10-May-2020 | 2,845 | $625 | |
| 10291 BRIDGEPORT ROAD | $1,300,000 | $1,097,000 | 18.51 | $1,350,000 | 23-Apr-2020 | 2003 | 12-May-2020 | 2,783 | $467 | |
| 8211 NO. 3 ROAD | $1,645,000 | $1,560,500 | 5.41 | $1,880,000 | 25-Mar-2020 | 1967 | 14-May-2020 | 2,500 | $658 |
3 out of 12 used unrenovated homes sold below assessed with a median sold price of 5.03
Burnaby
| Address | Sold Price | Assessed | % Δ | True List Price | True List Date | Year Built | Sold Date | Sqft | Price per sqft | Notes |
|---|---|---|---|---|---|---|---|---|---|---|
| 6931 AUBREY STREET | $1,372,000 | $1,329,000 | 3.24 | $1,289,900 | 14-Apr-2020 | 1973 | 22-Apr-2020 | 2,838 | $483 | |
| 132 N HOLDOM AVENUE | $2,000,000 | $1,588,800 | 25.88 | $2,388,000 | 25-Mar-2020 | 1966 | 22-Apr-2020 | 3,091 | $647 | Renovated/updated. |
| 3736 PETER STREET | $1,477,000 | $1,042,400 | 41.69 | $1,399,000 | 20-Apr-2020 | 1954 | 27-Apr-2020 | 2,216 | $666 | Renovated/updated. |
| 8035 11TH AVENUE | $2,045,000 | $1,751,000 | 16.79 | $2,249,000 | 31-Jan-2019 | 2015 | 27-Apr-2020 | 4,742 | $431 | |
| 7305 BRAESIDE DRIVE | $1,450,000 | $1,527,600 | -5.08 | $1,858,000 | 19-Mar-2018 | 1950 | 27-Apr-2020 | 2,205 | $657 | |
| 3581 PHILLIPS AVENUE | $1,300,000 | $1,410,700 | -7.85 | $1,499,800 | 30-Jul-2019 | 1960 | 28-Apr-2020 | 2,277 | $570 | Renovated/updated. |
| 7055 UNION STREET | $1,800,000 | $1,738,000 | 3.57 | $1,850,000 | 28-Apr-2020 | 1980 | 30-Apr-2020 | 3,263 | $551 | |
| 6532 IMPERIAL STREET | $1,200,000 | $1,103,000 | 8.79 | $1,499,000 | 08-Apr-2020 | 1981 | 01-May-2020 | 3,522 | $340 | |
| 6450 CLINTON STREET | $1,329,000 | $1,225,400 | 8.45 | $1,299,000 | 11-Sep-2019 | 1955 | 03-May-2020 | 2,000 | $664 | Renovated/updated. |
| 5060 HARDWICK STREET | $1,480,000 | $1,215,100 | 21.80 | $1,549,000 | 27-Apr-2020 | 1969 | 03-May-2020 | 2,241 | $660 | Renovated/updated. |
| 1841 MOORE AVENUE | $1,355,000 | $1,221,200 | 10.96 | $1,269,900 | 28-Apr-2020 | 1956 | 04-May-2020 | 2,005 | $675 | Renovated/updated. |
| 6388 CAULWYND PLACE | $2,060,000 | $1,705,000 | 20.82 | $2,288,890 | 26-Aug-2019 | 1981 | 04-May-2020 | 5,195 | $396 | Renovated/updated. |
| 6026 MCKEE STREET | $1,672,000 | $1,410,000 | 18.58 | $1,968,000 | 16-May-2017 | 2013 | 04-May-2020 | 2,404 | $695 | |
| 8089 11TH AVENUE | $2,040,000 | $1,769,000 | 15.32 | $2,188,000 | 29-Jan-2020 | 2016 | 05-May-2020 | 4,314 | $472 | |
| 4721 GEORGIA STREET | $1,371,000 | $1,187,000 | 15.50 | $1,428,800 | 27-Apr-2020 | 1975 | 05-May-2020 | 2,662 | $515 | Renovated/updated. |
| 8866 YARROW PLACE | $1,202,670 | $1,177,000 | 2.18 | $1,348,000 | 30-Dec-2019 | 1991 | 06-May-2020 | 2,534 | $474 | |
| 4990 LAUREL STREET | $1,130,000 | $1,180,200 | -4.25 | $1,175,000 | 05-May-2020 | 1954 | 11-May-2020 | 1,700 | $664 | |
| 295 N GAMMA AVENUE | $1,620,000 | $1,574,000 | 2.92 | $1,750,000 | 20-Apr-2020 | 1971 | 11-May-2020 | 2,706 | $598 | Renovated/updated. |
| 4505 CLINTON STREET | $1,349,000 | $1,235,000 | 9.23 | $1,349,000 | 04-May-2020 | 1955 | 11-May-2020 | 2,060 | $654 | |
| 8171 JOFFRE AVENUE | $1,625,000 | $1,277,000 | 27.25 | $1,474,900 | 05-May-2020 | 1950 | 12-May-2020 | 2,357 | $689 | Renovated/updated. |
| 4125 ETON STREET | $1,720,300 | $1,464,000 | 17.51 | $1,638,000 | 27-Nov-2019 | 2007 | 15-May-2020 | 2,255 | $762 | Renovated/updated. |
2 out of 10 used unrenovated homes sold below assessed with a median sold price of 6.18
West Vancouver
| Address | Sold Price | Assessed | % Δ | True List Price | True List Date | Year Built | Sold Date | Sqft | Price per sqft | Notes |
|---|---|---|---|---|---|---|---|---|---|---|
| 2675 SKILIFT PLACE | $1,441,110 | $1,794,900 | -19.71 | $2,088,000 | 01-May-2019 | 1958 | 23-Apr-2020 | 3,182 | $452 | |
| 3837 BAYRIDGE AVENUE | $1,653,000 | $1,786,700 | -7.48 | $1,798,000 | 15-Apr-2020 | 1964 | 26-Apr-2020 | 2,315 | $714 | Renovated/updated. |
| 1511 ERRIGAL PLACE | $4,400,000 | $5,695,000 | -22.74 | ? | 02-Apr-2014 | 2005 | 29-Apr-2020 | 8,306 | $529 | |
| 1488 CHARTWELL DRIVE | $4,120,000 | $5,041,000 | -18.27 | $8,980,000 | 28-Jun-2017 | 1991 | 02-May-2020 | 7,050 | $584 | |
| 2115 LAWSON AVENUE | $2,630,000 | $2,485,000 | 5.84 | $3,680,000 | 02-Mar-2016 | 1946 | 05-May-2020 | 3,017 | $871 | Renovated/updated. |
| 5727 BLUEBELL DRIVE | $2,122,000 | $1,752,000 | 21.12 | $2,280,000 | 06-Mar-2020 | 1958 | 05-May-2020 | 3,407 | $622 | Renovated/updated. |
| 1745 QUEENS AVENUE | $5,800,000 | $5,382,000 | 7.77 | $7,688,000 | 09-Sep-2019 | 2014 | 06-May-2020 | 6,587 | $880 | |
| 5967 MARINE DRIVE | $1,499,900 | $1,728,300 | -13.22 | $1,999,000 | 09-Oct-2015 | 1967 | 08-May-2020 | 2,063 | $727 | Renovated/updated. |
| 969 AUBENEAU CRESCENT | $2,203,000 | $2,203,000 | 0.00 | $2,980,000 | 09-Sep-2019 | 08-May-2020 | 5,400 | $407 | Brand New. | |
| 2150 NELSON AVENUE | $1,980,000 | $2,104,400 | -5.91 | $2,391,680 | 22-Apr-2020 | 1951 | 08-May-2020 | 1,922 | $1,030 | |
| 287 RABBIT LANE | $1,557,290 | $1,774,100 | -12.22 | $1,888,000 | 25-Jan-2019 | 1956 | 12-May-2020 | 2,094 | $743 | Renovated/updated. |
| 770 SOUTHBOROUGH DRIVE | $2,798,000 | $2,268,000 | 23.37 | $2,798,800 | 13-May-2020 | 1952 | 14-May-2020 | 4,012 | $697 | Renovated/updated. |
4 out of 5 used unrenovated homes sold below assessed with a median sold price of -18.27
New Westminster
| Address | Sold Price | Assessed | % Δ | True List Price | True List Date | Year Built | Sold Date | Sqft | Price per sqft | Notes |
|---|---|---|---|---|---|---|---|---|---|---|
| 904 THIRD AVENUE | $1,000,000 | $815,000 | 22.70 | $1,149,000 | 26-Mar-2020 | 1891 | 22-Apr-2020 | 1,551 | $644 | Renovated/updated. |
| 915 LEE STREET | $935,000 | $819,900 | 14.04 | $1,180,000 | 05-Sep-2018 | 1959 | 23-Apr-2020 | 2,054 | $455 | Renovated/updated. |
| 419 OAK STREET | $1,550,000 | $1,308,500 | 18.46 | $1,550,000 | 21-Apr-2020 | 1921 | 23-Apr-2020 | 2,404 | $644 | |
| 202 BLACKMAN STREET | $940,000 | $856,900 | 9.70 | $988,000 | 06-Apr-2020 | 1948 | 28-Apr-2020 | 1,706 | $550 | |
| 320 LAWRENCE STREET | $1,240,000 | $830,000 | 49.40 | $1,299,500 | 02-Apr-2020 | 2019 | 29-Apr-2020 | 3,545 | $349 | Brand New. |
| 314 REGINA STREET | $2,425,000 | $1,957,000 | 23.91 | $2,500,000 | 08-Apr-2020 | 2000 | 02-May-2020 | 4,094 | $592 | |
| 712 FIFTH STREET | $1,230,000 | $1,079,600 | 13.93 | $1,288,000 | 29-Apr-2020 | 1940 | 04-May-2020 | 2,895 | $424 | |
| 436 THIRD STREET | $1,790,000 | $1,500,000 | 19.33 | $1,850,000 | 27-Apr-2020 | 1925 | 06-May-2020 | 3,903 | $458 | |
| 264 JENSEN STREET | $908,000 | $858,000 | 5.83 | $939,900 | 06-Apr-2020 | 2008 | 07-May-2020 | 1,641 | $553 | |
| 451 WILSON STREET | $840,000 | $856,700 | -1.95 | $928,000 | 25-Mar-2019 | 1953 | 09-May-2020 | 926 | $907 | |
| 120 SINCLAIR AVENUE | $1,155,000 | $900,500 | 28.26 | $1,199,000 | 16-Mar-2020 | 1955 | 11-May-2020 | 2,608 | $442 | Renovated/updated. |
| 1815 LONDON STREET | $1,215,000 | $1,105,200 | 9.93 | $1,098,000 | 06-May-2020 | 1931 | 12-May-2020 | 1,525 | $796 | |
| 613 FOURTH STREET | $1,345,000 | $1,225,100 | 9.79 | $1,299,000 | 05-May-2020 | 1924 | 12-May-2020 | 2,682 | $501 | Renovated/updated. |
1 out of 8 used unrenovated homes sold below assessed with a median sold price of 11.93
North Vancouver
| Address | Sold Price | Assessed | % Δ | True List Price | True List Date | Year Built | Sold Date | Sqft | Price per sqft | Notes |
|---|---|---|---|---|---|---|---|---|---|---|
| 2670 SECHELT DRIVE | $1,625,000 | $1,527,000 | 6.42 | $1,786,800 | 23-Sep-2019 | 1960 | 23-Apr-2020 | 2,458 | $661 | Renovated/updated. |
| 742 WELLINGTON DRIVE | $1,480,000 | $1,397,000 | 5.94 | $1,549,900 | 23-Mar-2020 | 1959 | 24-Apr-2020 | 2,340 | $632 | Renovated/updated. |
| 490 W WINDSOR ROAD | $1,565,000 | $1,404,000 | 11.47 | $1,849,900 | 29-Oct-2018 | 1969 | 24-Apr-2020 | 2,797 | $559 | Renovated/updated. |
| 1373 WELLINGTON DRIVE | $1,540,000 | $1,411,000 | 9.14 | $1,549,000 | 23-Apr-2020 | 1974 | 26-Apr-2020 | 2,467 | $624 | Renovated/updated. |
| 538 W 14TH STREET | $1,385,000 | $1,269,000 | 9.14 | $1,445,000 | 21-Apr-2020 | 1954 | 26-Apr-2020 | 2,248 | $616 | |
| 1002 CANYON BOULEVARD | $980,000 | $1,341,400 | -26.94 | $1,049,000 | 16-Mar-2020 | 1964 | 26-Apr-2020 | 2,177 | $450 | |
| 609 W 24TH CLOSE | $1,535,000 | $1,668,000 | -7.97 | $1,880,000 | 23-Mar-2020 | 2010 | 26-Apr-2020 | 3,247 | $472 | |
| 998 DEMPSEY ROAD | $2,998,000 | $2,670,000 | 12.28 | $3,498,000 | 01-Oct-2019 | 1997 | 26-Apr-2020 | 6,977 | $429 | Renovated/updated. |
| 3059 PAISLEY ROAD | $3,070,000 | $2,687,000 | 14.25 | $3,388,000 | 05-Aug-2019 | 2019 | 27-Apr-2020 | 4,656 | $659 | |
| 423 E 12TH STREET | $1,388,000 | $1,318,900 | 5.24 | $1,399,000 | 20-Apr-2020 | 1948 | 27-Apr-2020 | 1,586 | $875 | |
| 4395 RICE LAKE ROAD | $1,001,000 | $646,300 | 54.88 | $799,000 | 22-Apr-2020 | 1920 | 28-Apr-2020 | 1,387 | $721 | Renovated/updated. |
| 515 E 19TH STREET | $1,580,000 | $1,294,400 | 22.06 | $1,498,000 | 24-Apr-2020 | 1948 | 28-Apr-2020 | 2,290 | $689 | |
| 5537 CLIFFRIDGE PLACE | $2,199,000 | $1,697,000 | 29.58 | $2,288,000 | 21-May-2015 | 1980 | 28-Apr-2020 | 3,283 | $669 | |
| 449 E 15TH STREET | $1,372,000 | $1,300,600 | 5.49 | $1,399,000 | 11-Jul-2019 | 1912 | 29-Apr-2020 | 2,150 | $638 | |
| 2380 W KEITH ROAD | $1,300,000 | $1,162,400 | 11.84 | $1,500,000 | 10-Jan-2020 | 1944 | 30-Apr-2020 | 2,416 | $538 | Renovated/updated. |
| 1827 PETERS ROAD | $1,600,000 | $1,445,000 | 10.73 | $1,599,800 | 21-Apr-2020 | 1997 | 01-May-2020 | 2,765 | $578 | Renovated/updated. |
| 3165 DUVAL ROAD | $1,770,000 | $1,536,000 | 15.23 | $1,789,000 | 24-Mar-2020 | 1972 | 03-May-2020 | 2,396 | $738 | Renovated/updated. |
| 3939 RUBY AVENUE | $3,047,520 | $2,822,000 | 7.99 | $3,590,000 | 30-Oct-2019 | 2019 | 05-May-2020 | 5,117 | $595 | Brand New. |
| 435 W 26TH STREET | $1,220,000 | $1,207,900 | 1.00 | $1,399,000 | 24-Oct-2018 | 1954 | 06-May-2020 | 1,956 | $623 | |
| 1513 RIDGEWAY AVENUE | $2,215,000 | $1,616,000 | 37.07 | $2,188,000 | 05-May-2020 | 2004 | 07-May-2020 | 3,171 | $698 | Renovated/updated. |
| 4388 MT SEYMOUR PARKWAY | $1,720,000 | $1,718,000 | 0.12 | ? | 07-Nov-2014 | 1990 | 09-May-2020 | 4,306 | $399 | |
| 3584 EMERALD DRIVE | $2,200,500 | $1,959,000 | 12.33 | $2,199,000 | 06-May-2020 | 1950 | 10-May-2020 | 2,262 | $972 | |
| 458 E 11TH STREET | $1,645,000 | $1,425,000 | 15.44 | $1,650,000 | 04-May-2020 | 1938 | 11-May-2020 | 2,452 | $670 | Renovated/updated. |
| 1123 ADDERLEY STREET | $1,480,000 | $1,241,100 | 19.25 | $1,328,800 | 07-May-2020 | 1954 | 12-May-2020 | 2,133 | $693 | Renovated/updated. |
| 1450 HOPE ROAD | $1,200,000 | $1,108,000 | 8.30 | $1,159,000 | 05-May-2020 | 1979 | 14-May-2020 | 1,205 | $995 | Renovated/updated. |
| 639 SEYMOUR COURT | $1,305,000 | $1,101,000 | 18.53 | $1,278,000 | 11-May-2020 | 1988 | 14-May-2020 | 2,181 | $598 | Renovated/updated. |
2 out of 10 used unrenovated homes sold below assessed with a median sold price of 5.36
Delta
| Address | Sold Price | Assessed | % Δ | True List Price | True List Date | Year Built | Sold Date | Sqft | Price per sqft | Notes |
|---|---|---|---|---|---|---|---|---|---|---|
| 11695 83A AVENUE | $880,000 | $824,000 | 6.80 | $899,000 | 21-Apr-2020 | 1972 | 24-Apr-2020 | 2,160 | $407 | |
| 11551 71A AVENUE | $901,079 | $806,300 | 11.75 | $899,900 | 14-Apr-2020 | 1974 | 26-Apr-2020 | 2,096 | $429 | Renovated/updated. |
| 5120 CLIFF DRIVE | $1,184,000 | $968,800 | 22.21 | $1,388,000 | 04-Jun-2019 | 1964 | 26-Apr-2020 | 2,423 | $488 | Renovated/updated. |
| 4941 1A AVENUE | $1,390,000 | $1,250,000 | 11.20 | $1,450,000 | 20-Apr-2020 | 1989 | 26-Apr-2020 | 2,941 | $472 | |
| 11404 79A AVENUE | $890,000 | $1,001,700 | -11.15 | $949,900 | 15-Apr-2020 | 1980 | 27-Apr-2020 | 2,811 | $316 | Renovated/updated. |
| 5383 SPETIFORE CRESCENT | $1,400,000 | $1,314,000 | 6.54 | $1,488,000 | 27-Feb-2020 | 2006 | 28-Apr-2020 | 3,155 | $443 | |
| 5346 4A AVENUE | $1,068,000 | $1,014,700 | 5.25 | $1,298,000 | 02-Mar-2018 | 1972 | 29-Apr-2020 | 2,655 | $402 | |
| 9182 HARDY ROAD | $1,100,000 | $1,035,000 | 6.28 | $1,138,000 | 24-Apr-2020 | 1987 | 29-Apr-2020 | 2,905 | $378 | Renovated/updated. |
| 4906 4 AVENUE | $1,265,000 | $1,119,100 | 13.04 | $1,299,900 | 09-Mar-2020 | 1968 | 29-Apr-2020 | 3,032 | $417 | |
| 4631 46A STREET | $1,057,000 | $955,900 | 10.58 | $1,069,000 | 13-Mar-2020 | 1901 | 29-Apr-2020 | 1,834 | $576 | Renovated/updated. |
| 1117 JACKSON WAY | $1,353,000 | $1,114,600 | 21.39 | $1,320,000 | 09-Apr-2020 | 1971 | 01-May-2020 | 2,921 | $463 | Renovated/updated. |
| 6646 ALBION WAY | $991,000 | $985,200 | 0.59 | $1,050,000 | 27-Apr-2020 | 1969 | 01-May-2020 | 2,016 | $491 | |
| 237 66A STREET | $970,000 | $979,000 | -0.92 | $1,198,000 | 13-Aug-2019 | 1962 | 02-May-2020 | 1,970 | $492 | |
| 5222 LYNN PLACE | $1,235,000 | $1,184,000 | 4.31 | $1,299,000 | 06-Apr-2020 | 2011 | 03-May-2020 | 2,680 | $460 | |
| 5962 49A AVENUE | $878,000 | $855,800 | 2.59 | $998,800 | 20-Jun-2018 | 1987 | 03-May-2020 | 1,790 | $490 | Renovated/updated. |
| 5538 1 AVENUE | $1,010,000 | $961,000 | 5.10 | $1,125,000 | 22-Sep-2019 | 1983 | 04-May-2020 | 1,800 | $561 | Renovated/updated. |
| 5422 7 AVENUE | $1,110,000 | $1,076,000 | 3.16 | $1,110,000 | 01-May-2020 | 1963 | 04-May-2020 | 2,989 | $371 | |
| 11748 73A AVENUE | $900,000 | $807,600 | 11.44 | $899,000 | 05-May-2020 | 1967 | 07-May-2020 | 2,200 | $409 | Renovated/updated. |
| 11037 84A AVENUE | $838,000 | $812,500 | 3.14 | $850,000 | 05-May-2020 | 1973 | 08-May-2020 | 2,189 | $382 | |
| 5039 DUFFY PLACE | $1,305,000 | $927,200 | 40.75 | $1,389,000 | 21-Jan-2020 | 1971 | 09-May-2020 | 2,917 | $447 | Renovated/updated. |
| 1442 BEACH GROVE ROAD | $1,650,000 | $1,546,400 | 6.70 | $1,750,000 | 07-May-2020 | 1931 | 12-May-2020 | 1,880 | $877 |
1 out of 11 used unrenovated homes sold below assessed with a median sold price of 5.25
Surrey
| Address | Sold Price | Assessed | % Δ | True List Price | True List Date | Year Built | Sold Date | Sqft | Price per sqft | Notes |
|---|---|---|---|---|---|---|---|---|---|---|
| 10948 142 STREET | $1,000,000 | $796,800 | 25.50 | $969,000 | 20-Apr-2020 | 1987 | 22-Apr-2020 | 2,661 | $375 | |
| 5653 148A STREET | $875,000 | $827,000 | 5.80 | $829,000 | 27-Nov-2018 | 2004 | 22-Apr-2020 | 2,409 | $363 | Renovated/updated. |
| 11036 135A STREET | $877,000 | $782,700 | 12.05 | $898,000 | 16-Apr-2020 | 1952 | 22-Apr-2020 | 1,812 | $483 | |
| 6198 KILLARNEY DRIVE | $1,070,000 | $986,800 | 8.43 | $1,328,800 | 08-Sep-2017 | 1980 | 22-Apr-2020 | 2,610 | $409 | Renovated/updated. |
| 6363 135A STREET | $760,000 | $906,000 | -16.11 | $749,900 | 14-Apr-2020 | 1998 | 22-Apr-2020 | 1,695 | $448 | |
| 9311 163A STREET | $1,260,000 | $1,277,000 | -1.33 | $1,299,800 | 17-Apr-2020 | 1990 | 22-Apr-2020 | 2,634 | $478 | |
| 16267 MORGAN CREEK CRESCENT | $1,548,000 | $1,600,000 | -3.25 | $1,888,000 | 04-Jul-2019 | 1995 | 23-Apr-2020 | 4,440 | $348 | |
| 6748 151A STREET | $1,365,000 | $1,182,000 | 15.48 | ? | 12-Mar-2015 | 2004 | 23-Apr-2020 | 3,984 | $342 | Renovated/updated. |
| 10119 MARY DRIVE | $775,000 | $706,300 | 9.73 | $825,000 | 12-Mar-2020 | 1956 | 24-Apr-2020 | 1,505 | $514 | Renovated/updated. |
| 18167 66 AVENUE | $1,180,000 | $1,089,000 | 8.36 | $1,288,000 | 05-Mar-2020 | 1999 | 24-Apr-2020 | 3,833 | $307 | Renovated/updated. |
| 14370 68B AVENUE | $955,000 | $911,000 | 4.83 | $1,050,000 | 04-Oct-2018 | 1985 | 24-Apr-2020 | 2,008 | $475 | Renovated/updated. |
| 18239 CLAYTONHILL DRIVE | $1,210,000 | $1,118,000 | 8.23 | ? | 08-May-2012 | 2002 | 25-Apr-2020 | 3,716 | $325 | Renovated/updated. |
| 26 1400 164 STREET | $495,000 | $460,300 | 7.54 | $549,000 | 30-Sep-2019 | 1987 | 25-Apr-2020 | 1,076 | $460 | Renovated/updated. |
| 5788 168 STREET | $985,000 | $982,000 | 0.31 | $1,079,000 | 18-Mar-2020 | 1995 | 25-Apr-2020 | 3,380 | $291 | Renovated/updated. |
| 9686 151A STREET | $858,000 | $846,000 | 1.42 | ? | 16-Jul-2014 | 1989 | 26-Apr-2020 | 1,818 | $471 | Renovated/updated. |
| 11079 162A STREET | $1,155,000 | $1,204,000 | -4.07 | $1,329,900 | 09-Mar-2020 | 1994 | 26-Apr-2020 | 3,759 | $307 | Renovated/updated. |
| 11547 ROXBURGH ROAD | $1,000,000 | $983,000 | 1.73 | $995,000 | 20-Apr-2020 | 2000 | 26-Apr-2020 | 2,646 | $377 | |
| 14963 83A AVENUE | $1,131,000 | $1,050,000 | 7.71 | $1,099,900 | 20-Apr-2020 | 1991 | 26-Apr-2020 | 3,608 | $313 | Renovated/updated. |
| 2568 163A STREET | $1,418,000 | $1,329,000 | 6.70 | $1,449,000 | 08-Apr-2020 | 2008 | 27-Apr-2020 | 3,417 | $414 | Renovated/updated. |
| 1523 133B STREET | $2,125,000 | $1,627,000 | 30.61 | $2,558,890 | 16-Jul-2019 | 2018 | 27-Apr-2020 | 3,555 | $597 | |
| 16751 85 AVENUE | $1,149,800 | $1,033,000 | 11.31 | $1,219,800 | 08-Feb-2020 | 1996 | 27-Apr-2020 | 3,174 | $362 | Renovated/updated. |
| 10112 158A STREET | $865,000 | $841,500 | 2.79 | $849,900 | 23-Apr-2020 | 1988 | 28-Apr-2020 | 1,729 | $500 | |
| 7875 167A STREET | $980,000 | $915,100 | 7.09 | $998,000 | 08-Apr-2020 | 1988 | 29-Apr-2020 | 2,489 | $393 | Renovated/updated. |
| 1970 158A STREET | $1,250,000 | $1,416,000 | -11.72 | $1,499,000 | 04-Nov-2019 | 1990 | 30-Apr-2020 | 2,881 | $433 | |
| 6553 129A STREET | $855,000 | $776,300 | 10.14 | $918,000 | 27-Mar-2020 | 1953 | 01-May-2020 | 2,305 | $370 | |
| 12095 82 AVENUE | $955,000 | $962,000 | -0.73 | $1,050,000 | 08-Apr-2020 | 1975 | 01-May-2020 | 2,848 | $335 | Renovated/updated. |
| 10853 144 STREET | $730,000 | $763,700 | -4.41 | $699,800 | 08-Jul-2016 | 1953 | 01-May-2020 | 1,840 | $396 | |
| 17985 56A AVENUE | $2,045,000 | $1,710,000 | 19.59 | $2,299,000 | 02-Oct-2019 | 2016 | 01-May-2020 | 6,345 | $322 | |
| 7685 147 STREET | $1,275,000 | $1,218,000 | 4.68 | $1,299,800 | 21-Apr-2020 | 2005 | 02-May-2020 | 4,064 | $313 | |
| 12712 112B AVENUE | $459,000 | $504,700 | -9.05 | $499,000 | 06-Jan-2020 | 1950 | 02-May-2020 | 1,020 | $450 | |
| 6086 172B STREET | $1,515,000 | $1,272,000 | 19.10 | $1,595,000 | 22-Apr-2020 | 2015 | 03-May-2020 | 5,003 | $302 | |
| 19014 67A AVENUE | $1,150,000 | $923,000 | 24.59 | $1,175,000 | 12-Mar-2020 | 2011 | 03-May-2020 | 3,079 | $373 | Renovated/updated. |
| 8462 165A STREET | $915,000 | $994,000 | -7.95 | $998,800 | 29-Jan-2020 | 1991 | 03-May-2020 | 2,050 | $446 | |
| 19383 72 AVENUE | $1,060,000 | $916,000 | 15.72 | $1,088,000 | 07-Apr-2020 | 2010 | 04-May-2020 | 3,013 | $351 | |
| 10229 129 STREET | $947,500 | $839,400 | 12.88 | $1,049,900 | 17-Mar-2020 | 1955 | 04-May-2020 | 1,163 | $814 | |
| 8999 146 STREET | $897,500 | $808,700 | 10.98 | $929,000 | 27-Apr-2020 | 1982 | 05-May-2020 | 2,167 | $414 | |
| 18940 72 AVENUE | $1,015,000 | $869,000 | 16.80 | $838,800 | 24-Aug-2016 | 2005 | 05-May-2020 | 3,063 | $331 | |
| 70 15288 36 AVENUE | $1,050,000 | $1,012,000 | 3.75 | $1,095,000 | 29-Mar-2020 | 2003 | 05-May-2020 | 3,067 | $342 | Renovated/updated. |
| 7321 150A STREET | $1,215,000 | $1,173,000 | 3.58 | $1,299,650 | 02-Apr-2020 | 1988 | 05-May-2020 | 3,895 | $311 | Renovated/updated. |
| 12842 CARLUKE CRESCENT | $1,895,500 | $1,716,000 | 10.46 | $2,299,000 | 10-Jul-2019 | 2018 | 06-May-2020 | 6,563 | $288 | |
| 12734 16 AVENUE | $925,000 | $799,200 | 15.74 | $935,000 | 06-May-2020 | 1975 | 09-May-2020 | 1,561 | $592 | Renovated/updated. |
| 8076 135A STREET | $1,275,000 | $1,181,000 | 7.96 | $1,299,000 | 08-May-2020 | 2005 | 09-May-2020 | 4,164 | $306 | |
| 8108 170 STREET | $1,345,000 | $1,203,000 | 11.80 | $1,380,000 | 06-May-2020 | 2004 | 09-May-2020 | 4,390 | $306 | Renovated/updated. |
| 14992 69 AVENUE | $1,430,000 | $1,337,000 | 6.96 | $1,480,000 | 02-Mar-2020 | 2005 | 10-May-2020 | 5,462 | $261 | |
| 15401 KILDARE DRIVE | $1,220,000 | $1,056,600 | 15.46 | $1,298,000 | 09-Mar-2020 | 1980 | 11-May-2020 | 2,907 | $419 | Renovated/updated. |
| 15511 105A AVENUE | $882,000 | $804,300 | 9.66 | $899,000 | 04-May-2020 | 1979 | 12-May-2020 | 2,075 | $425 | Renovated/updated. |
| 5909 135A STREET | $950,000 | $890,800 | 6.65 | $999,000 | 11-Mar-2020 | 1974 | 12-May-2020 | 1,810 | $524 | Renovated/updated. |
7 out of 23 used unrenovated homes sold below assessed with a median sold price of 7.96
Port Moody
| Address | Sold Price | Assessed | % Δ | True List Price | True List Date | Year Built | Sold Date | Sqft | Price per sqft | Notes |
|---|---|---|---|---|---|---|---|---|---|---|
| 2 ASPEN COURT | $1,543,000 | $1,534,000 | 0.59 | $1,588,000 | 07-Apr-2020 | 1990 | 25-Apr-2020 | 4,601 | $335 | |
| 167 COLLEGE PARK WAY | $1,175,000 | $1,115,000 | 5.38 | $1,199,000 | 03-Feb-2020 | 1967 | 27-Apr-2020 | 2,442 | $481 | |
| 1 ALDER DRIVE | $1,273,000 | $1,379,000 | -7.69 | $1,489,000 | 21-May-2019 | 2005 | 29-Apr-2020 | 2,556 | $498 | |
| 610 WATERLOO DRIVE | $1,488,500 | $1,440,000 | 3.37 | $1,558,000 | 03-Mar-2020 | 1974 | 02-May-2020 | 3,824 | $389 | Renovated/updated. |
| 45 MOUNT ROYAL DRIVE | $1,100,000 | $918,000 | 19.83 | $1,068,000 | 29-Apr-2020 | 1963 | 03-May-2020 | 1,835 | $599 | Renovated/updated. |
1 out of 3 used unrenovated homes sold below assessed with a median sold price of 0.59
Coquitlam
| Address | Sold Price | Assessed | % Δ | True List Price | True List Date | Year Built | Sold Date | Sqft | Price per sqft | Notes |
|---|---|---|---|---|---|---|---|---|---|---|
| 840 LEVIS STREET | $1,247,000 | $1,112,700 | 12.07 | $1,248,800 | 06-Apr-2020 | 1964 | 22-Apr-2020 | 2,442 | $510 | Renovated/updated. |
| 3471 SHEFFIELD AVENUE | $1,348,000 | $1,385,000 | -2.67 | $1,488,000 | 03-Feb-2020 | 2015 | 23-Apr-2020 | 3,180 | $423 | |
| 3370 SCOTCH PINE AVENUE | $1,815,000 | $1,705,000 | 6.45 | $2,100,000 | 24-Jun-2019 | 2009 | 25-Apr-2020 | 4,865 | $373 | |
| 341 MUNDY STREET | $830,000 | $840,700 | -1.27 | $899,900 | 02-Feb-2020 | 1972 | 27-Apr-2020 | 1,665 | $498 | |
| 411 MUNDY STREET | $1,350,000 | $1,248,000 | 8.17 | $1,424,800 | 03-Mar-2020 | 1998 | 30-Apr-2020 | 3,489 | $386 | |
| 260 CHESTER COURT | $1,065,000 | $1,022,800 | 4.13 | $1,150,000 | 17-Mar-2020 | 1963 | 02-May-2020 | 2,311 | $460 | |
| 3484 DANIELSON DRIVE | $1,628,570 | $619,000 | 163.10 | $1,710,000 | 01-May-2020 | 02-May-2020 | 3,863 | $421 | Renovated/updated. Brand New. | |
| 2972 DELAHAYE DRIVE | $1,230,000 | $1,128,000 | 9.04 | $1,175,000 | 30-Apr-2020 | 1987 | 03-May-2020 | 3,703 | $332 | |
| 3392 DON MOORE DRIVE | $1,350,000 | $1,228,000 | 9.93 | $1,359,000 | 26-Aug-2019 | 2009 | 04-May-2020 | 3,332 | $405 | |
| 3371 PRINCETON AVENUE | $1,235,000 | $1,175,000 | 5.11 | ? | 27-Apr-2012 | 2012 | 05-May-2020 | 3,187 | $387 | |
| 660 GATENSBURY STREET | $1,330,000 | $1,127,800 | 17.93 | $1,369,000 | 29-Apr-2020 | 1958 | 05-May-2020 | 1,639 | $811 | |
| 1299 CREEKSTONE TERRACE | $1,450,000 | $1,435,000 | 1.05 | $1,499,000 | 21-Apr-2020 | 2013 | 07-May-2020 | 3,918 | $370 | |
| 1125 WALLACE COURT | $935,000 | $997,000 | -6.22 | $999,800 | 01-May-2020 | 1983 | 08-May-2020 | 2,257 | $414 | |
| 1239 OXBOW WAY | $775,000 | $732,700 | 5.77 | $798,000 | 28-Apr-2020 | 1980 | 08-May-2020 | 1,861 | $416 | Renovated/updated. |
| 1111 REGAN AVENUE | $2,090,000 | $1,597,400 | 30.84 | $2,100,000 | 27-Apr-2020 | 1946 | 09-May-2020 | 1,270 | $1,645 | |
| 2954 BOUTHOT COURT | $998,800 | $779,500 | 28.13 | $998,800 | 08-May-2020 | 1980 | 15-May-2020 | 2,072 | $482 | Renovated/updated. |
| 770 AUSTIN AVENUE | $1,275,000 | $1,159,000 | 10.01 | $1,298,000 | 11-May-2020 | 1975 | 17-May-2020 | 2,562 | $497 | Renovated/updated. |
| 958 DANSEY AVENUE | $1,482,000 | $1,252,000 | 18.37 | $1,469,900 | 15-May-2020 | 1998 | 17-May-2020 | 3,132 | $473 | |
| 1419 MADORE AVENUE | $1,225,000 | $1,210,000 | 1.24 | $1,249,000 | 11-May-2020 | 1964 | 19-May-2020 | 2,385 | $513 |
3 out of 14 used unrenovated homes sold below assessed with a median sold price of 5.78
Port Coquitlam
| Address | Sold Price | Assessed | % Δ | True List Price | True List Date | Year Built | Sold Date | Sqft | Price per sqft | Notes |
|---|---|---|---|---|---|---|---|---|---|---|
| 1868 FRASER AVENUE | $770,000 | $747,500 | 3.01 | $769,000 | 15-Apr-2020 | 1924 | 22-Apr-2020 | 2,487 | $309 | |
| 2266 PITT RIVER ROAD | $830,000 | $700,400 | 18.50 | $699,999 | 01-Feb-2016 | 1945 | 22-Apr-2020 | 2,740 | $302 | |
| 3443 RALEIGH STREET | $1,110,000 | $944,000 | 17.58 | $1,150,000 | 13-Mar-2017 | 1959 | 23-Apr-2020 | 1,840 | $603 | Renovated/updated. |
| 1940 HOMFELD PLACE | $1,015,000 | $856,200 | 18.55 | $1,039,000 | 21-Apr-2020 | 1979 | 26-Apr-2020 | 2,568 | $395 | Renovated/updated. |
| 2391 THAMES CRESCENT | $1,060,000 | $956,000 | 10.88 | $1,075,000 | 26-Feb-2020 | 1997 | 26-Apr-2020 | 2,214 | $478 | Renovated/updated. |
| 2106 NOVA SCOTIA AVENUE | $765,000 | $693,000 | 10.39 | $799,000 | 22-Apr-2020 | 1987 | 26-Apr-2020 | 1,402 | $545 | |
| 1360 MARY HILL LANE | $974,000 | $918,200 | 6.08 | ? | 19-Sep-2011 | 1975 | 27-Apr-2020 | 2,259 | $431 | |
| 2187 RINDALL AVENUE | $884,000 | $916,000 | -3.49 | $928,000 | 03-Mar-2020 | 1984 | 30-Apr-2020 | 2,011 | $439 | |
| 2470 KENSINGTON CRESCENT | $1,082,000 | $1,025,000 | 5.56 | $1,089,000 | 28-Apr-2020 | 1988 | 02-May-2020 | 3,287 | $329 | Renovated/updated. |
| 1437 BRAKEN COURT | $900,000 | $876,000 | 2.74 | $949,900 | 03-Apr-2020 | 1974 | 03-May-2020 | 2,334 | $385 | Renovated/updated. |
| 2040 LANGAN AVENUE | $735,000 | $673,100 | 9.20 | $738,000 | 01-Mar-2020 | 1914 | 05-May-2020 | 1,437 | $511 | Renovated/updated. |
| 3082 SHAUGHNESSY STREET | $851,888 | $795,400 | 7.10 | $858,888 | 09-Mar-2020 | 1953 | 06-May-2020 | 1,217 | $699 | |
| 2346 NACHT AVENUE | $1,054,500 | $947,000 | 11.35 | $1,098,000 | 19-Mar-2020 | 1991 | 06-May-2020 | 2,739 | $384 |
1 out of 7 used unrenovated homes sold below assessed with a median sold price of 7.10
Pitt Meadows
| Address | Sold Price | Assessed | % Δ | True List Price | True List Date | Year Built | Sold Date | Sqft | Price per sqft | Notes |
|---|---|---|---|---|---|---|---|---|---|---|
| 19688 BLANEY DRIVE | $1,060,000 | $957,000 | 10.76 | $1,098,700 | 11-Mar-2020 | 2004 | 04-May-2020 | 2,794 | $379 | Renovated/updated. |
| 19722 ALOUETTE BOULEVARD | $1,010,000 | $954,000 | 5.87 | $1,020,000 | 05-May-2020 | 2004 | 09-May-2020 | 2,687 | $375 |
0 out of 1 used unrenovated homes sold below assessed with a median sold price of 5.87
Langley
| Address | Sold Price | Assessed | % Δ | True List Price | True List Date | Year Built | Sold Date | Sqft | Price per sqft | Notes |
|---|---|---|---|---|---|---|---|---|---|---|
| 21425 90 AVENUE | $946,000 | $901,000 | 4.99 | $969,000 | 16-Apr-2020 | 1993 | 22-Apr-2020 | 2,614 | $361 | |
| 20949 43 AVENUE | $1,290,000 | $1,125,000 | 14.67 | $1,298,000 | 16-Apr-2020 | 1996 | 22-Apr-2020 | 4,214 | $306 | |
| 3888 204 STREET | $1,400,000 | $1,480,000 | -5.41 | $1,469,000 | 14-Apr-2020 | 2012 | 22-Apr-2020 | 5,053 | $277 | |
| 9271 206B STREET | $1,260,000 | $1,061,000 | 18.76 | $1,398,600 | 03-Mar-2020 | 1997 | 22-Apr-2020 | 3,629 | $347 | Renovated/updated. |
| 7895 211B STREET | $1,055,000 | $1,010,000 | 4.46 | ? | 22-Oct-2010 | 2010 | 23-Apr-2020 | 2,612 | $403 | Renovated/updated. |
| 70 WAGONWHEEL CRESCENT | $1,625,000 | $1,536,000 | 5.79 | $1,699,000 | 17-Mar-2020 | 1989 | 23-Apr-2020 | 3,778 | $430 | Renovated/updated. |
| 21127 78B AVENUE | $1,165,000 | $1,119,000 | 4.11 | $1,179,000 | 15-Apr-2020 | 2010 | 24-Apr-2020 | 3,650 | $319 | |
| 7001 201 STREET | $920,000 | $846,000 | 8.75 | $939,800 | 01-Apr-2020 | 2007 | 24-Apr-2020 | 2,833 | $324 | |
| 6614 205A STREET | $869,000 | $753,000 | 15.41 | $879,000 | 25-Mar-2020 | 2002 | 25-Apr-2020 | 2,695 | $322 | Renovated/updated. |
| 19980 50 AVENUE | $999,900 | $1,086,000 | -7.93 | $999,900 | 07-Apr-2020 | 1974 | 27-Apr-2020 | 2,375 | $421 | Renovated/updated. |
| 20450 77A AVENUE | $1,257,020 | $652,000 | 92.79 | $1,304,670 | 27-Apr-2020 | 30-Apr-2020 | 3,715 | $338 | Brand New. | |
| 4553 196A STREET | $920,000 | $774,000 | 18.86 | $960,000 | 20-Apr-2020 | 1979 | 30-Apr-2020 | 2,275 | $404 | |
| 19684 71A AVENUE | $1,190,000 | $1,168,000 | 1.88 | $1,388,880 | 20-Apr-2016 | 2006 | 01-May-2020 | 4,142 | $287 | Renovated/updated. |
| 4059 207 STREET | $1,129,000 | $880,200 | 28.27 | $1,139,000 | 03-Apr-2020 | 1977 | 01-May-2020 | 2,126 | $531 | Renovated/updated. |
| 9242 203 STREET | $1,090,000 | $1,065,000 | 2.35 | $1,148,500 | 23-Mar-2020 | 1993 | 02-May-2020 | 2,187 | $498 | Renovated/updated. |
| 22169 OLD YALE ROAD | $850,000 | $1,017,000 | -16.42 | $899,000 | 07-Apr-2020 | 1971 | 03-May-2020 | 1,831 | $464 | Renovated/updated. |
| 22938 BILLY BROWN ROAD | $1,215,000 | $1,144,000 | 6.21 | $1,348,800 | 17-Feb-2020 | 2007 | 12-May-2020 | 2,629 | $462 |
1 out of 8 used unrenovated homes sold below assessed with a median sold price of 7.48
Maple Ridge
| Address | Sold Price | Assessed | % Δ | True List Price | True List Date | Year Built | Sold Date | Sqft | Price per sqft | Notes |
|---|---|---|---|---|---|---|---|---|---|---|
| 10447 SLATFORD STREET | $974,000 | $926,000 | 5.18 | $999,888 | 17-Apr-2020 | 1999 | 22-Apr-2020 | 4,178 | $233 | |
| 10345 243 STREET | $810,000 | $732,000 | 10.66 | $799,900 | 31-Mar-2020 | 2003 | 25-Apr-2020 | 2,464 | $328 | |
| 26887 OLIVER AVENUE | $525,000 | $650,900 | -19.34 | $799,900 | 23-Oct-2018 | 1937 | 25-Apr-2020 | 1,628 | $322 | |
| 12145 202 STREET | $785,000 | $750,000 | 4.67 | $819,000 | 01-Apr-2020 | 1985 | 26-Apr-2020 | 1,507 | $520 | |
| 11345 MELVILLE STREET | $708,000 | $703,000 | 0.71 | $679,900 | 24-Apr-2020 | 1985 | 27-Apr-2020 | 2,317 | $305 | |
| 24125 102B AVENUE | $773,000 | $741,000 | 4.32 | $799,900 | 02-Apr-2020 | 2002 | 29-Apr-2020 | 2,418 | $319 | |
| 20330 THORNE AVENUE | $727,000 | $716,000 | 1.54 | $749,900 | 27-Mar-2020 | 1983 | 03-May-2020 | 1,866 | $389 | Renovated/updated. |
| 22866 GILBERT DRIVE | $920,000 | $898,000 | 2.45 | $939,000 | 23-Mar-2020 | 2011 | 03-May-2020 | 2,448 | $375 | |
| 23780 KANAKA WAY | $793,000 | $728,000 | 8.93 | $804,900 | 16-Apr-2020 | 2003 | 03-May-2020 | 2,211 | $358 | Renovated/updated. |
| 12297 216 STREET | $773,000 | $661,000 | 16.94 | $829,000 | 30-Mar-2020 | 1935 | 03-May-2020 | 1,698 | $455 | |
| 24263 102 AVENUE | $689,000 | $635,000 | 8.50 | $689,900 | 20-Apr-2020 | 2002 | 04-May-2020 | 2,442 | $282 | Renovated/updated. |
| 23541 109 LOOP | $960,000 | $889,000 | 7.99 | $969,000 | 09-Apr-2020 | 2002 | 04-May-2020 | 3,563 | $269 | |
| 11696 CARSHILL STREET | $863,000 | $712,100 | 21.19 | $876,000 | 25-Mar-2020 | 1966 | 04-May-2020 | 2,544 | $339 | Renovated/updated. |
| 16 13210 SHOESMITH CRESCENT | $1,038,800 | $1,015,000 | 2.34 | $1,175,000 | 26-Mar-2020 | 2010 | 05-May-2020 | 3,126 | $332 | |
| 11387 240A STREET | $1,169,900 | $1,053,000 | 11.10 | $1,199,900 | 21-Apr-2020 | 2007 | 05-May-2020 | 4,162 | $281 | |
| 20515 120B AVENUE | $891,400 | $879,000 | 1.41 | $869,900 | 04-May-2020 | 1992 | 06-May-2020 | 2,349 | $379 | |
| 21654 MANOR AVENUE | $750,000 | $718,000 | 4.46 | $828,800 | 03-Feb-2020 | 1975 | 07-May-2020 | 2,100 | $357 | |
| 11741 GLENHURST STREET | $876,950 | $735,000 | 19.31 | $949,000 | 19-Mar-2020 | 1987 | 07-May-2020 | 2,657 | $330 | Renovated/updated. |
| 11022 240 STREET | $945,000 | $745,000 | 26.85 | $899,900 | 05-Feb-2020 | 2019 | 07-May-2020 | 3,280 | $288 | Brand New. |
| 21086 COOK AVENUE | $840,000 | $658,000 | 27.66 | $859,900 | 07-May-2020 | 1975 | 08-May-2020 | 1,818 | $462 | Renovated/updated. |
1 out of 13 used unrenovated homes sold below assessed with a median sold price of 4.46
White Rock
| Address | Sold Price | Assessed | % Δ | True List Price | True List Date | Year Built | Sold Date | Sqft | Price per sqft | Notes |
|---|---|---|---|---|---|---|---|---|---|---|
| 15187 ROYAL AVENUE | $1,068,000 | $1,110,800 | -3.85 | $1,498,000 | 28-Jan-2019 | 1974 | 24-Apr-2020 | 1,840 | $580 | Renovated/updated. |
| 15887 BUENA VISTA AVENUE | $998,000 | $998,400 | -0.04 | $719,900 | 12-Oct-2013 | 1954 | 24-Apr-2020 | 2,218 | $449 | |
| 15141 COLUMBIA AVENUE | $1,850,000 | $2,047,000 | -9.62 | $1,898,000 | 06-Apr-2020 | 2014 | 29-Apr-2020 | 3,600 | $513 | |
| 1580 LEE STREET | $841,000 | $882,300 | -4.68 | $995,000 | 21-Feb-2020 | 1952 | 04-May-2020 | 2,044 | $411 |
3 out of 3 used unrenovated homes sold below assessed with a median sold price of -4.68
Anmore
| Address | Sold Price | Assessed | % Δ | True List Price | True List Date | Year Built | Sold Date | Sqft | Price per sqft | Notes |
|---|---|---|---|---|---|---|---|---|---|---|
| 213 WESTRIDGE LANE | $2,325,000 | $2,259,000 | 2.92 | $2,488,800 | 06-Apr-2020 | 2006 | 12-May-2020 | 4,634 | $501 |
0 out of 1 used unrenovated homes sold below assessed with a median sold price of 2.92
References
| 1. | ↑ | https://faculty.wharton.upenn.edu/wp-content/uploads/2013/05/Brown_2013_House_Price_Index_Methodology_1.pdf |