

Pete Fry won Vancouver’s mayoralty on Oct. 17 by more than 31,000 votes, but the city did not vote as one. Results from all 144 in-person voting places show a city split roughly in two. Fry ran up large margins across the north and east, while incumbent Ken Sim carried most of the south.
ThinkPol mapped the gap between the two candidates at every voting place, using official results the City of Vancouver posted to its open data portal, and estimated the margin for the areas in between.

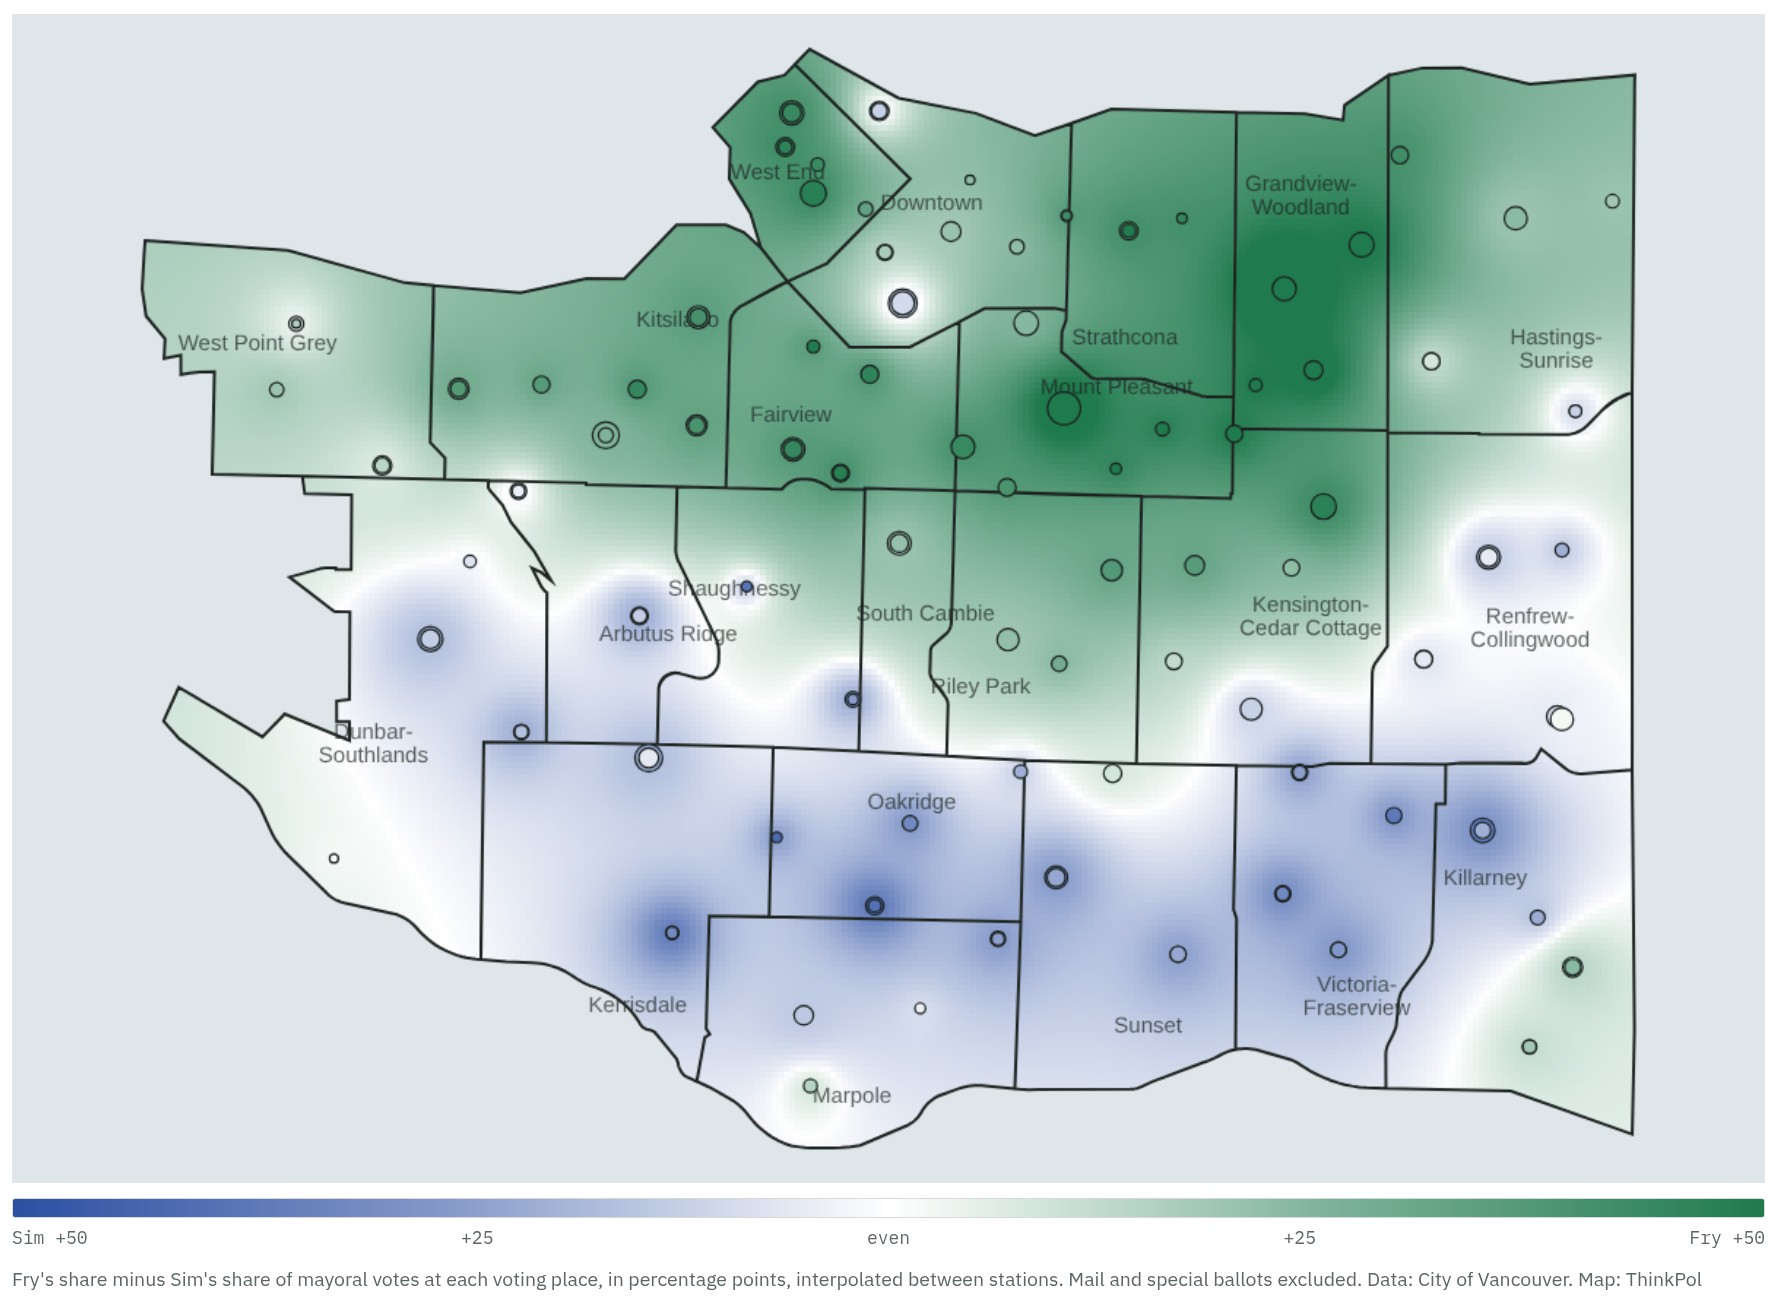
Explore the interactive map: hover or tap any voting place to see its vote count, or switch to nearest-station zones.
The citywide result
Fry, the Green Party’s candidate, finished with 98,748 votes, or 47.8 per cent of valid mayoral votes. Sim, running for ABC Vancouver, took 67,598 (32.7 per cent). TEAM’s Colleen Hardwick was third with 18,156 (8.8 per cent), followed by Kareem Allam of the Vancouver Liberals with 10,609 and Rebecca Bligh of Vote Vancouver with 8,701. Three other candidates shared about 2,800 votes.
Turnout was 43.4 per cent. Of 483,324 registered voters, 209,711 cast ballots, including residents of UBC and the University Endowment Lands, who vote only for school trustee.
Fry’s east and north
Fry’s strongest ground was a band running from the West End through Mount Pleasant to Grandview-Woodland. In Grandview-Woodland, voting places gave Fry 8,353 votes to Sim’s 1,475, a margin of 61 points. Fry also led by more than 40 points in Mount Pleasant, the West End, Strathcona and Fairview, and by 32 points in Kitsilano.
The single most lopsided station was Britannia Community Elementary School, where Fry beat Sim by 74 points. Three of Fry’s five best stations were in Grandview-Woodland.
Fry’s lead faded heading south and east. Kensington-Cedar Cottage and Riley Park still went to Fry by about 25 points, South Cambie by 17 and Hastings-Sunrise by 13.
Sim’s south
Sim won 57 of the 144 voting places, most of them in the southern half of the city, along with four downtown. Oakridge was his best neighbourhood, at 34 points ahead of Fry, followed by Victoria-Fraserview (31), Shaughnessy (30) and Kerrisdale (21). Sim also carried Arbutus Ridge, Sunset, Dunbar-Southlands, Marpole, Killarney and Renfrew-Collingwood.
His best single station was Dr. R. E. McKechnie Elementary School in Kerrisdale, where Sim beat Fry by 50 points. Sir Winston Churchill Secondary in Oakridge, which served both as an advance and an election-day voting place, gave Sim margins of about 40 points on both occasions.
The close calls
A few areas were nearly even. Downtown’s 14 voting places split 6,866 for Fry and 6,368 for Sim, a three-point gap. West Point Grey went to Fry by five points, and Renfrew-Collingwood and Killarney went to Sim by eight and nine.
Mail ballots, which can’t be placed on a map, broke even more heavily for Fry than the in-person vote, 9,042 to 4,526. Sim narrowly won the special voting opportunities, such as those held at care facilities, 509 to 375.
Reading the map
The results are counted where people voted, not where they live. Large advance-voting sites and busy downtown stations take in voters from across the city, so the map shows where each candidate’s support was concentrated, not a precise picture of every block. The interpolation fills gaps between stations by giving more weight to nearby and busier ones. In areas with few stations, such as the southwestern edge of Dunbar-Southlands, the shading rests on only one or two results.
| Neighbourhood | Fry | Sim | Margin |
|---|---|---|---|
| Grandview-Woodland | 8,353 | 1,475 | Fry +61 |
| Mount Pleasant | 10,789 | 3,118 | Fry +46 |
| West End | 7,352 | 2,165 | Fry +44 |
| Strathcona | 1,780 | 636 | Fry +43 |
| Fairview | 5,504 | 1,676 | Fry +42 |
| Kitsilano | 8,524 | 3,357 | Fry +32 |
| Kensington-Cedar Cottage | 8,009 | 4,118 | Fry +27 |
| Riley Park | 3,857 | 2,048 | Fry +25 |
| South Cambie | 1,820 | 1,193 | Fry +17 |
| Hastings-Sunrise | 4,374 | 3,202 | Fry +13 |
| West Point Grey | 1,805 | 1,571 | Fry +5 |
| Downtown | 6,866 | 6,368 | Fry +3 |
| Renfrew-Collingwood | 4,143 | 5,042 | Sim +8 |
| Killarney | 3,227 | 4,003 | Sim +9 |
| Marpole | 1,820 | 2,506 | Sim +13 |
| Dunbar-Southlands | 2,024 | 3,092 | Sim +16 |
| Sunset | 2,560 | 3,943 | Sim +17 |
| Arbutus Ridge | 1,206 | 1,925 | Sim +18 |
| Kerrisdale | 1,767 | 3,061 | Sim +21 |
| Shaughnessy | 495 | 1,099 | Sim +30 |
| Victoria-Fraserview | 1,805 | 3,985 | Sim +31 |
| Oakridge | 1,251 | 2,980 | Sim +34 |
In-person votes at voting places located in each neighbourhood. Margin is in percentage points of all mayoral votes cast at those stations.
Source: City of Vancouver open data, “Municipal election results” (2026 Municipal Election, official results by voting place) and “Voting places 2026.” Analysis and map by ThinkPol.


